Amazon Sales Data Analysis
A two-script Python pipeline that extracts the fee detail buried in raw Amazon sales data and turns it into sales, return-rate, and profit-margin charts.
Overview
A small, focused Python project that turns raw Amazon sales exports into the handful of metrics a seller actually watches. It extracts the fee detail buried in the raw data, then computes sales performance, return rates, and profit margins, and renders each as a chart. No dashboard, no database; just pandas for the math and Matplotlib for the visuals.
What It Does
| Stage | Script | Output |
|---|---|---|
| Process | data_pipeline.py | Reads the raw Amazon data and extracts per-order fee information into processed_amazon_data.csv |
| Analyze | data_analysis.py | Calculates sales, net proceeds, return rates, and profit margins, then writes plots and CSVs to plots/ |
There's also data_analysis.ipynb for poking at the processed data interactively before committing a change to the scripts.
Sample Outputs
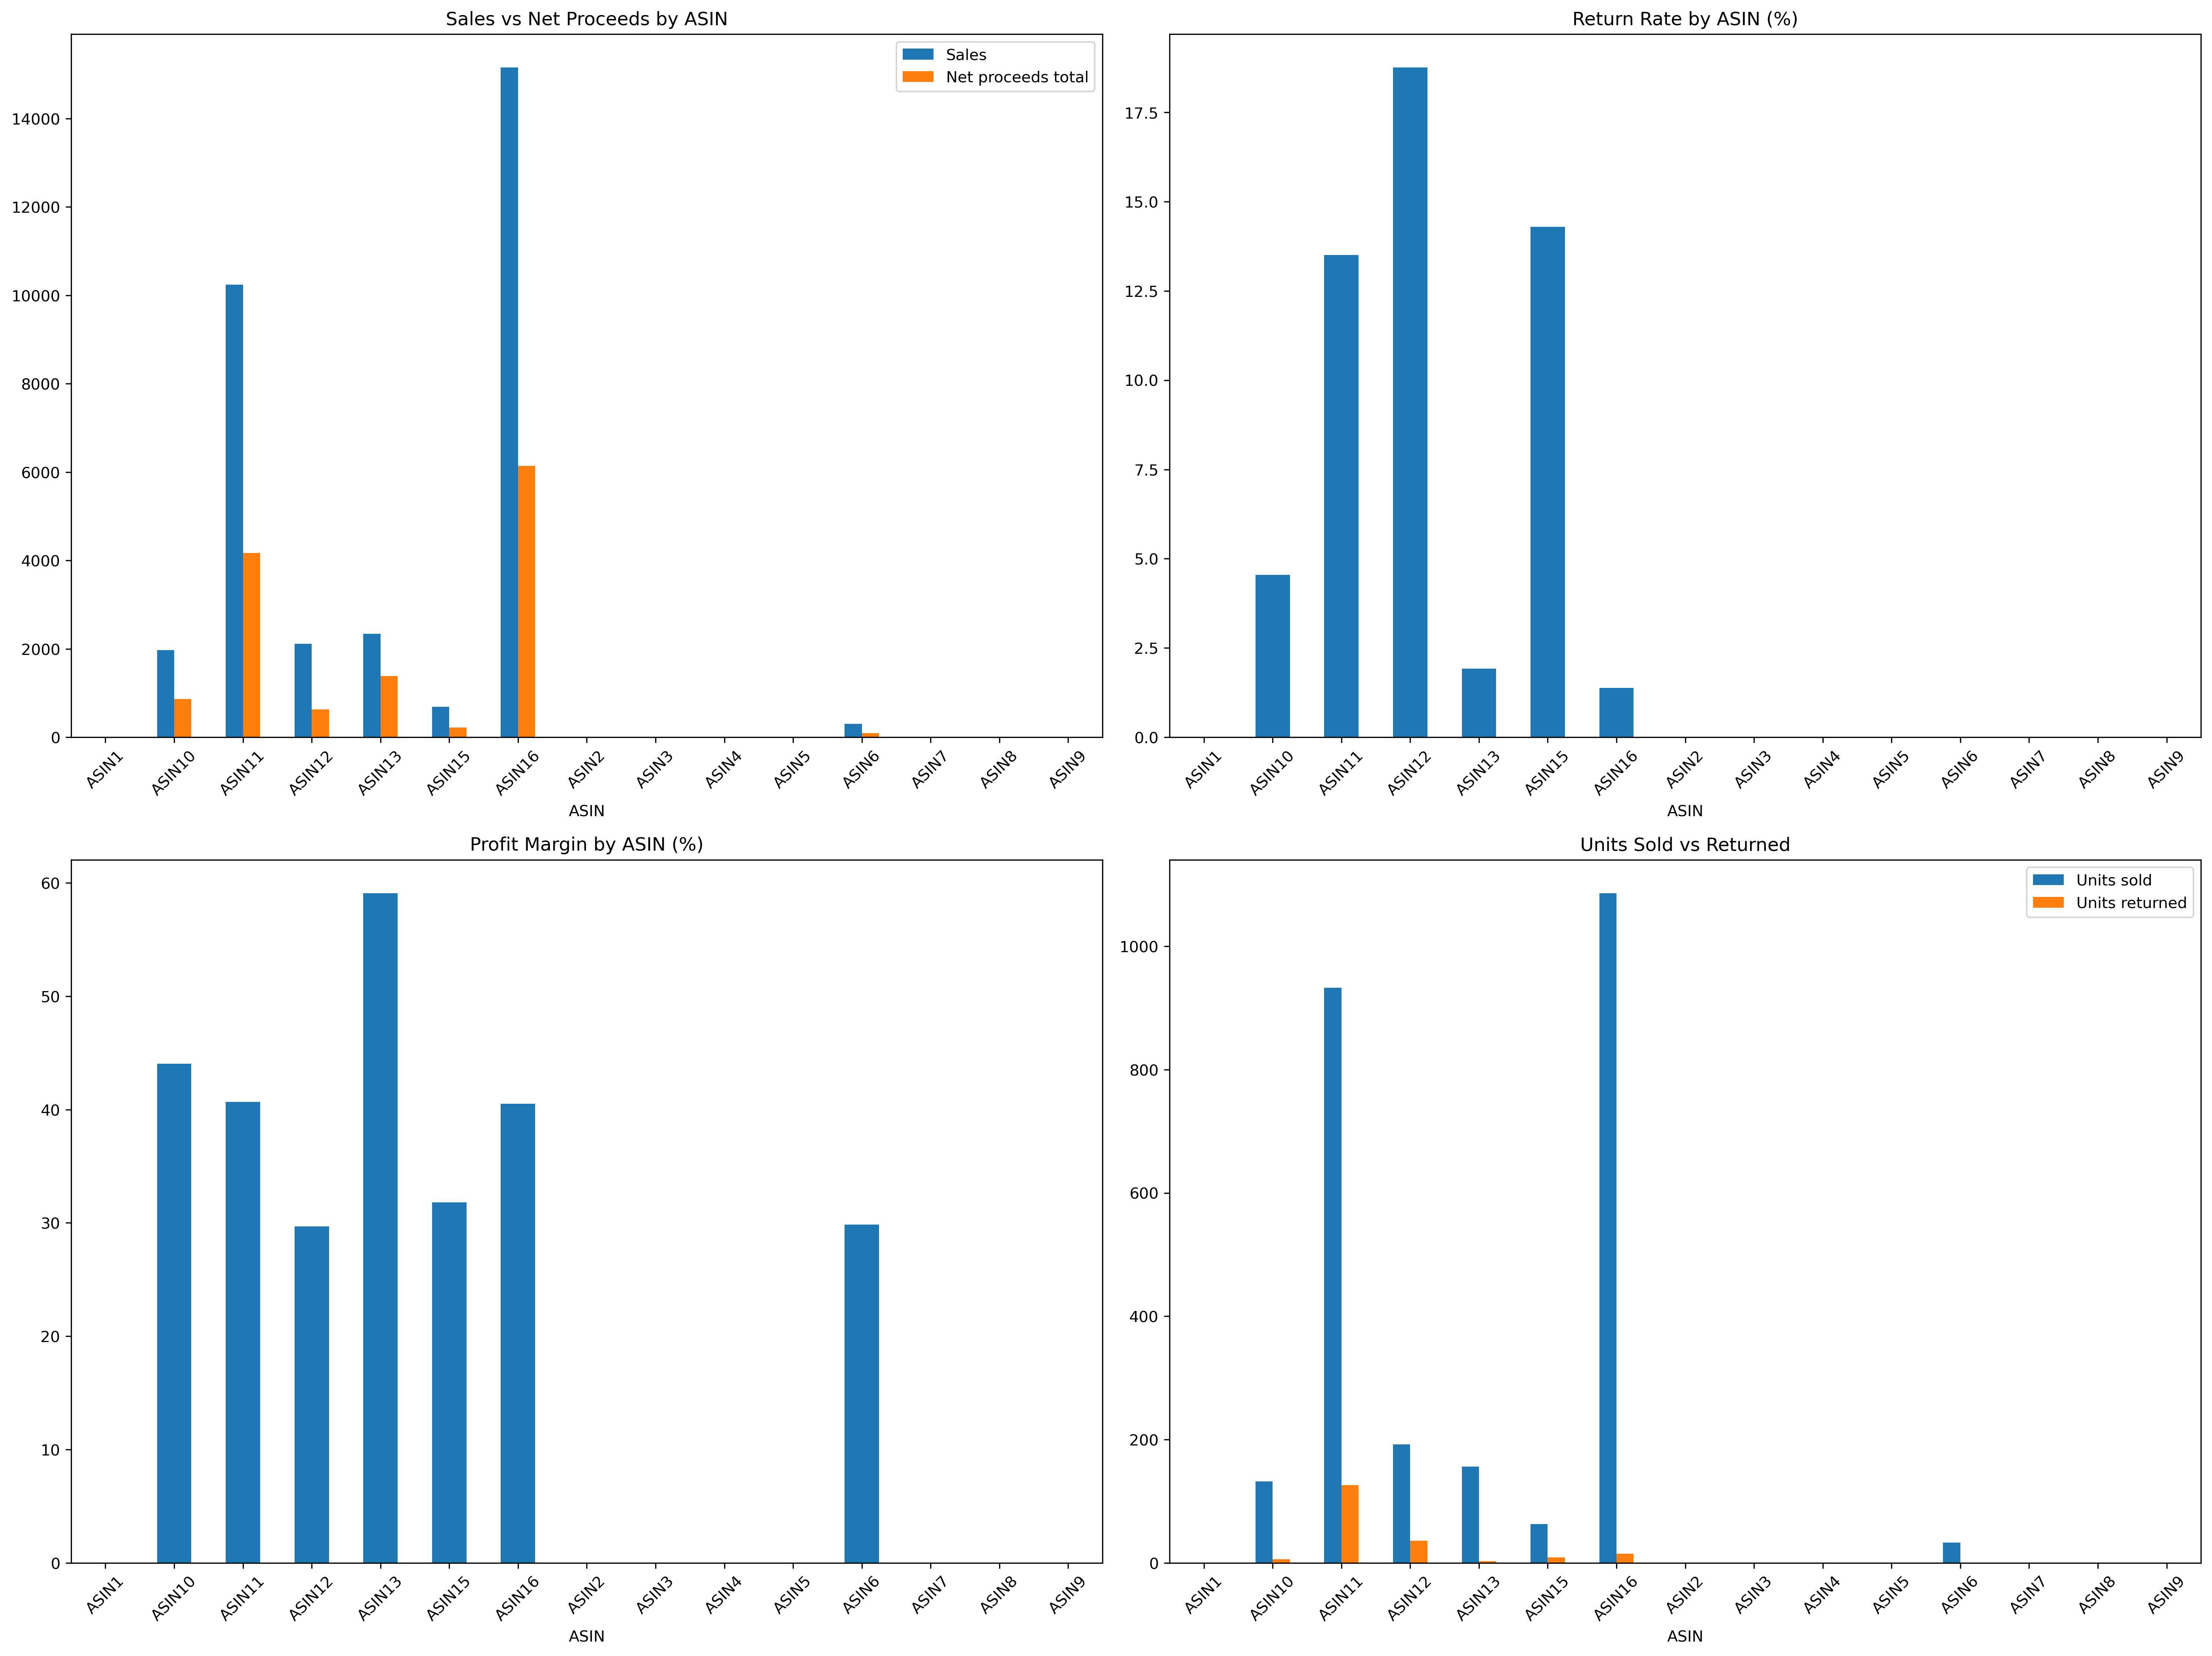 Sales vs. net proceeds, return rates, and profit margins
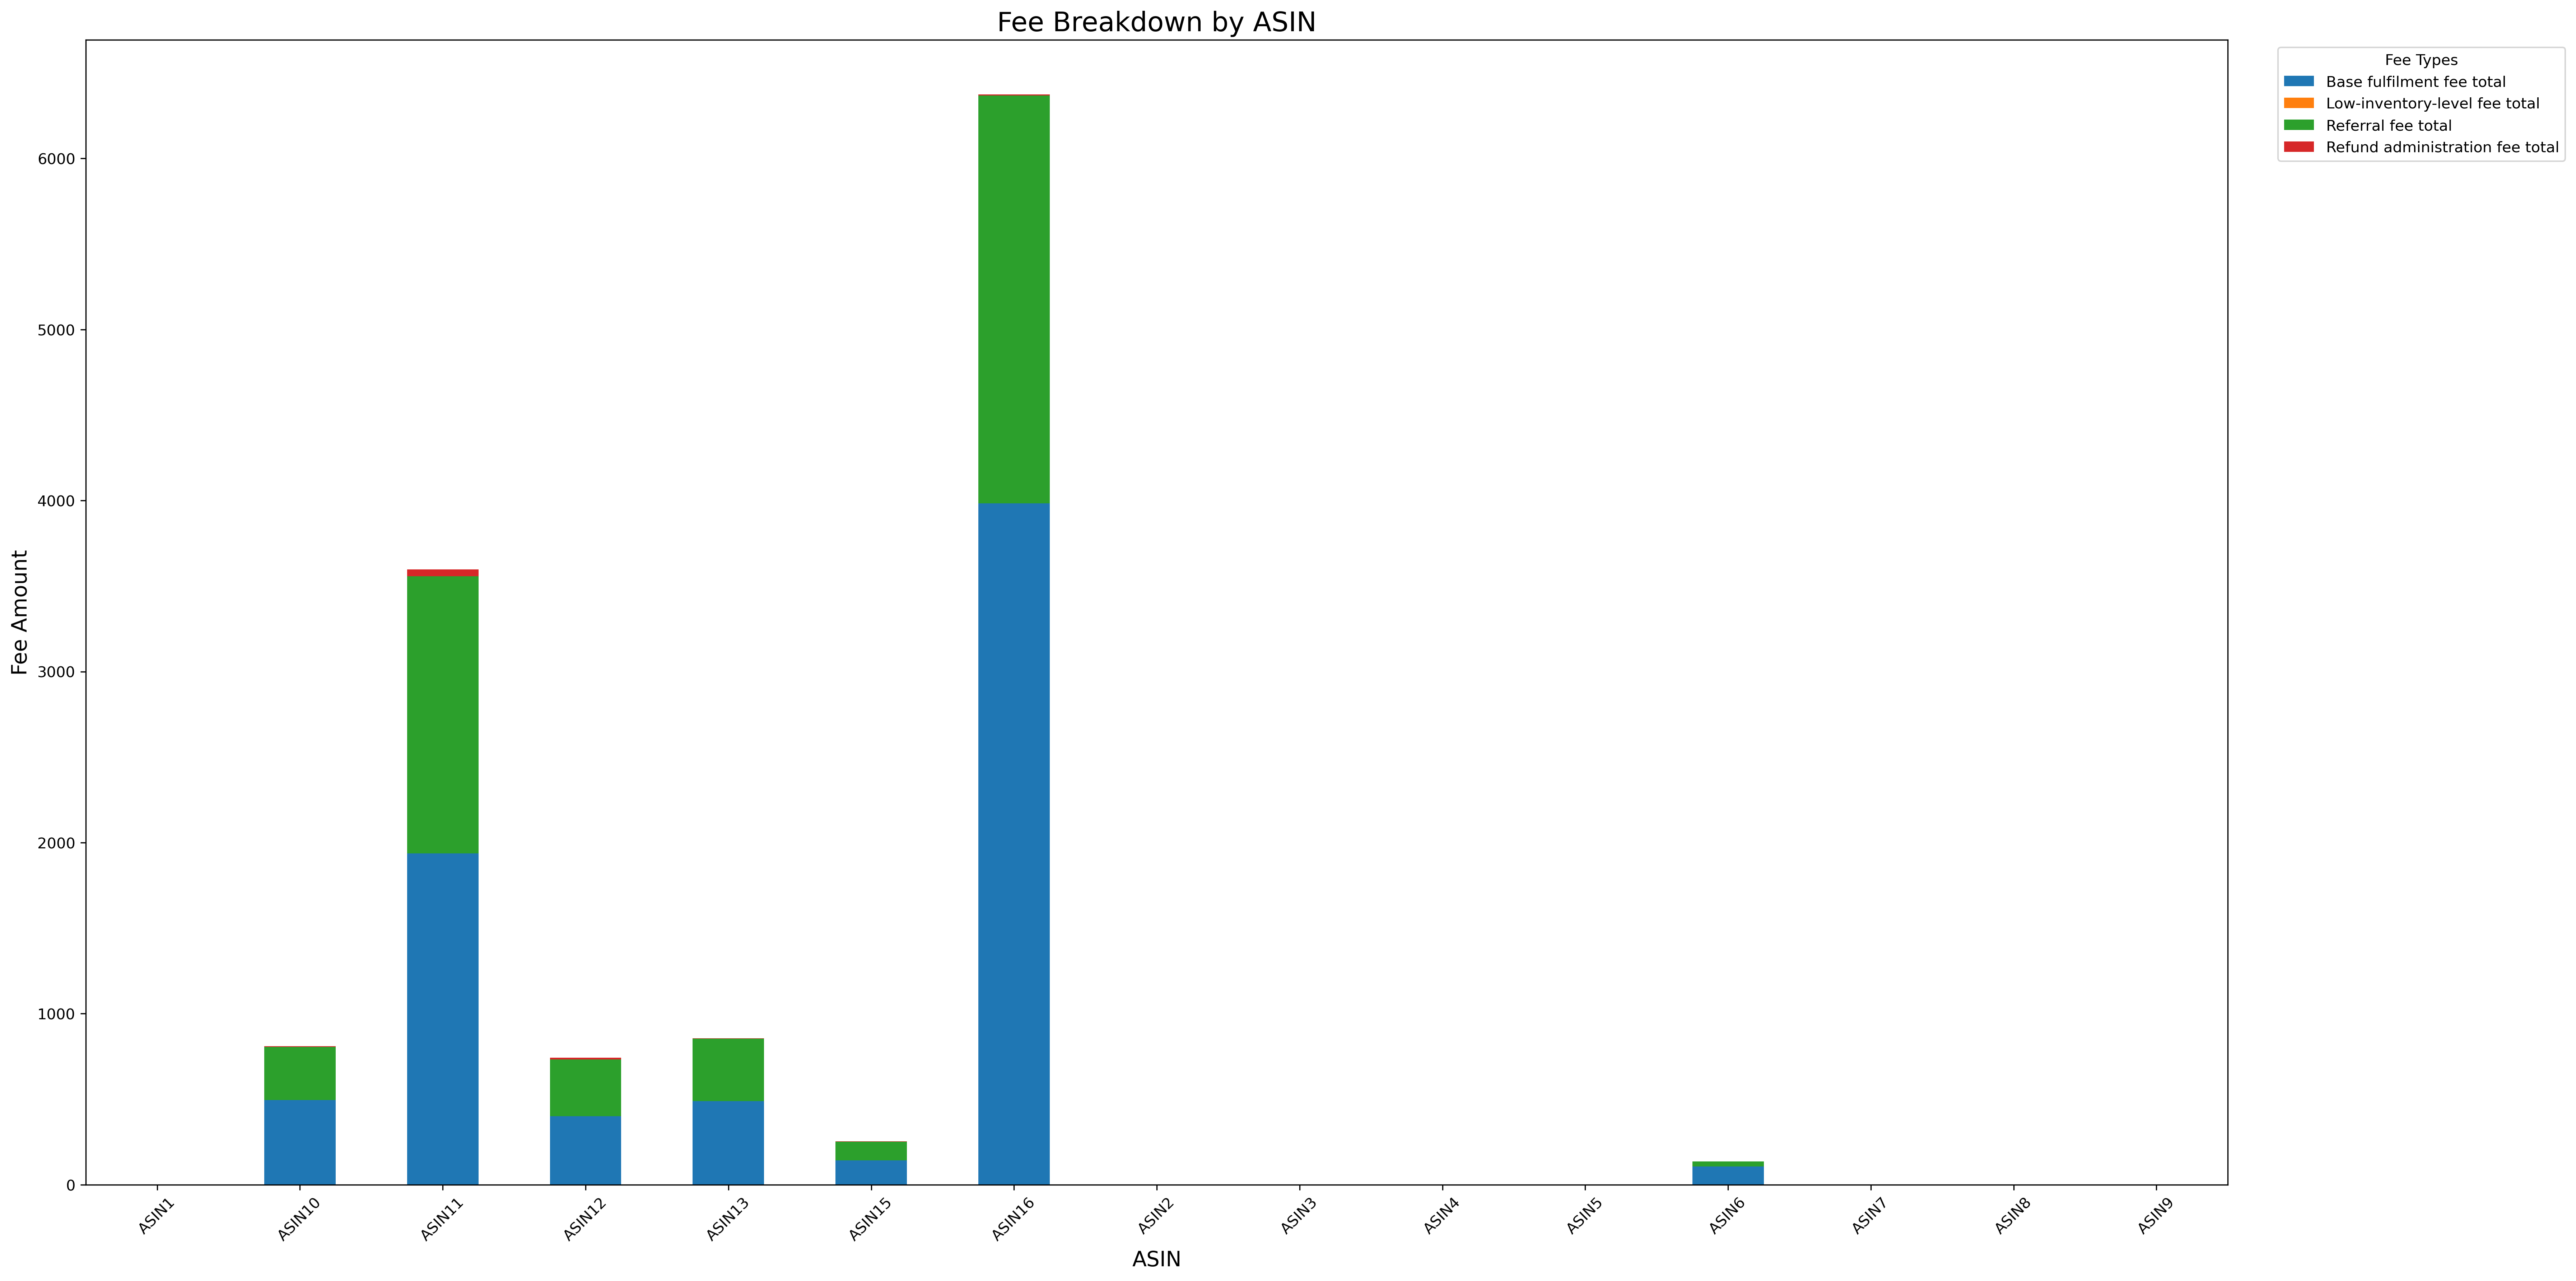 Breakdown of Amazon-related fees
Each plot is paired with a CSV in plots/, so the numbers behind a chart can be checked without re-running the pipeline.
Stack
Python · pandas · Matplotlib: two dependencies (pip install pandas matplotlib) and two commands. dummydata.txt ships as a raw sample and processed_amazon_data.csv as its processed counterpart, so the scripts run end to end on a fresh clone.
Takeaway
The value here isn't the charts. It's the fee extraction. Once fees are separated from the gross figures, return rate and profit margin stop being guesswork and the plots fall out of the pipeline. Full setup instructions live in the repository README.