Data Science Portfolio
Seven end-to-end data science projects on public datasets, each taken from a real question to a plain-language answer, shipped as a live Streamlit dashboard backed by executed notebooks.
Overview
Data engineering work shows up as pipelines, schemas, and dashboards. This repository is the other half of the job: doing the analysis itself.
Seven independent projects, one per method, all built the same way. Ask a specific question about a public dataset. Treat cleaning as a set of decisions with a cost. Establish a baseline before reaching for a model. Improve on that baseline without fooling yourself. Close with a plain-language answer, the limitations it carries, and what would change it.
This workflow comes from WorldQuant University's Applied Data Science Lab, which I completed in 2026. Every project here applies it to independent public datasets rather than coursework, and every question, notebook, and write-up is my own.
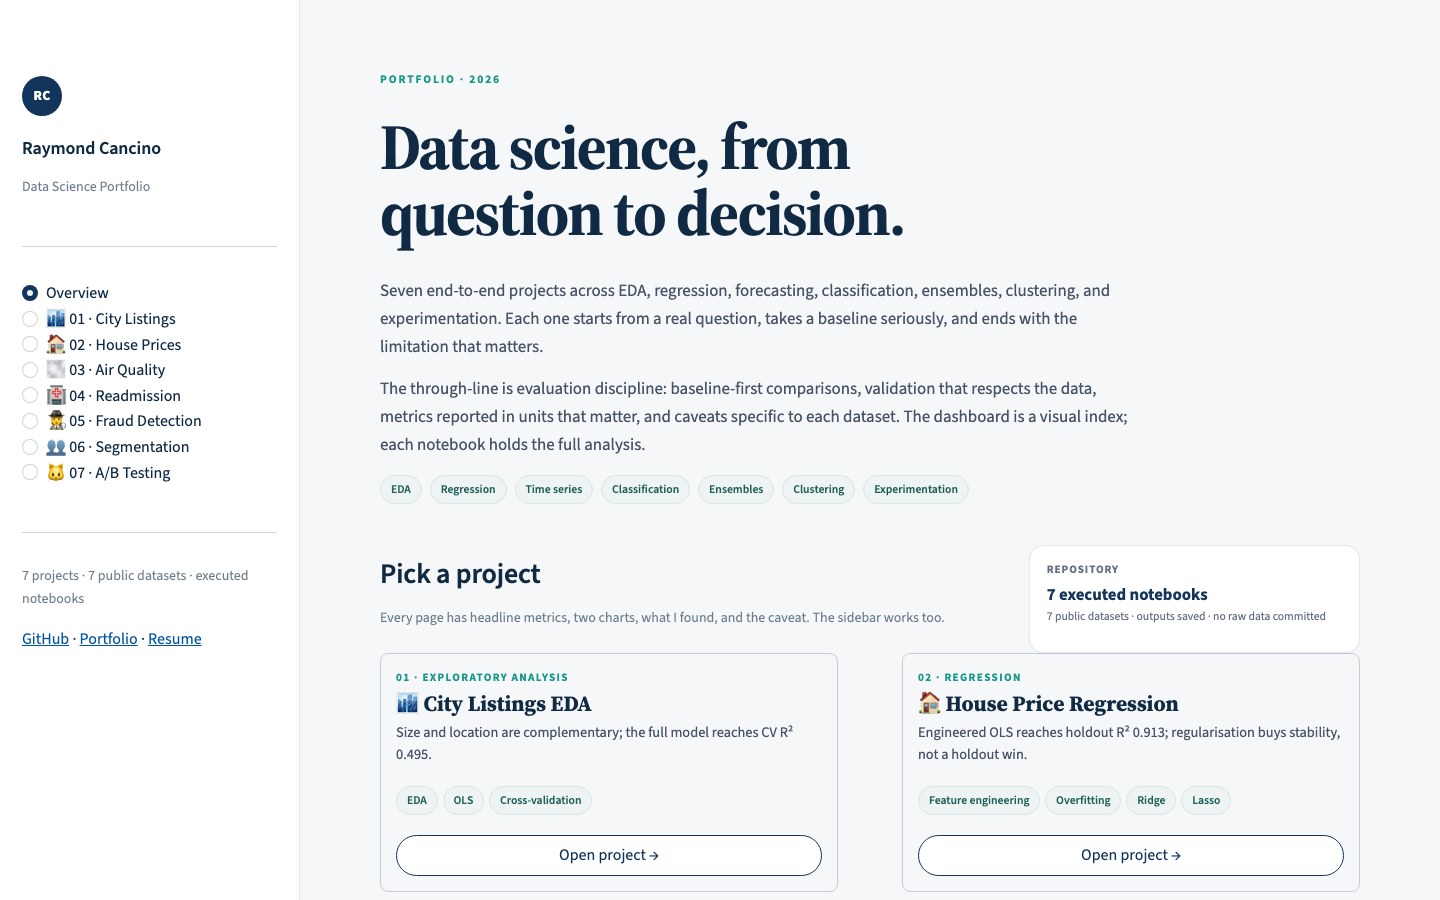
The notebooks are committed already executed, so their charts and metrics render on GitHub without installing anything. The live dashboard is a visual index over the whole body of work: one overview page plus a page per project with headline metrics, two charts, the method, and the caveat.
The Seven Projects
| Project | Method | Headline result |
|---|---|---|
| City Listings EDA | EDA, OLS on log price, cross-validation | Full model CV R² 0.495. Location adds 0.175 R² on top of size and room type; size adds 0.115 on top of location and room type. |
| House Price Regression | Feature engineering, Ridge, Lasso | Engineered OLS holdout R² 0.913, RMSE $22,788. Regularization cut CV log-RMSE from 0.163 to 0.140/0.138 but did not win the holdout. |
| Air Quality Time Series | SARIMA, lag features, recursive forecasting | Ridge lag model 6.45 µg/m³ at 90 days vs 7.08 for a seasonal baseline; 5.42 one step ahead. |
| Hospital Readmission | Classification, class imbalance, leakage-aware splits | 88.8% accuracy but only 2.5% recall unweighted. Balanced logistic recall 54.3%, ROC-AUC 0.667. |
| Fraud Detection | Ensembles, PR-AUC, cost-sensitive thresholds | Random Forest PR-AUC 0.782 vs logistic 0.723. A cost-optimal threshold catches 77% of frauds. |
| Customer Segmentation | RFM, K-Means, silhouette | Five segments; Champions = 7.8% of customers but 52.9% of revenue. Log-RFM clustering beats a raw-RFM outlier split. |
| A/B Testing | Chi-square, power, SRM, SQLite | 7-day retention 19.02% vs 18.20% (+0.82 pp, p = 0.0016); 1-day retention not significant. |
Each project folder carries its own README with the data source, licence, download steps, full results, and the skills it demonstrates. The repository README has the same table with links.
What the Results Showed
- Accuracy was the wrong headline for readmission. Predicting no readmission for every patient scores 88.8% on the holdout. The unweighted model hits exactly that accuracy while catching 55 of 2,216 readmissions, a 2.5% recall. Class weights lift recall to 54.3% at 18.2% precision, and the honest conclusion is that readmission is only weakly predictable from administrative data.
- PR-AUC and ROC-AUC disagreed, and the disagreement is the point. Random Forest scored better on PR-AUC (0.782 vs 0.723) while logistic regression scored better on ROC-AUC (0.977 vs 0.935). With 0.173% positives, ROC-AUC is dominated by easy negatives, so the threshold was chosen on validation for cost and checked once on test.
- A segment only earns its name if it changes a decision. The five RFM segments put Champions at 7.8% of customers and 52.9% of revenue. Raw-RFM clustering scored a higher silhouette by isolating six and eight customers, which is outlier detection, not segmentation.
- Forecast skill fades with horizon, so the notebook says where. The ridge lag model lands at 5.42 µg/m³ one step ahead and 6.45 at 90 days, against a 7.08 seasonal baseline.
- The A/B test kept the gate at 30. Seven-day retention moved 0.82 pp (p = 0.0016) while one-day retention did not (p = 0.074), and the decision follows the metric that mattered.
The Dashboard
The app is deliberately data-independent. It reads the summary results committed alongside the notebooks, so it deploys with no datasets and no secrets, and every page links back to the notebook that produced its numbers.
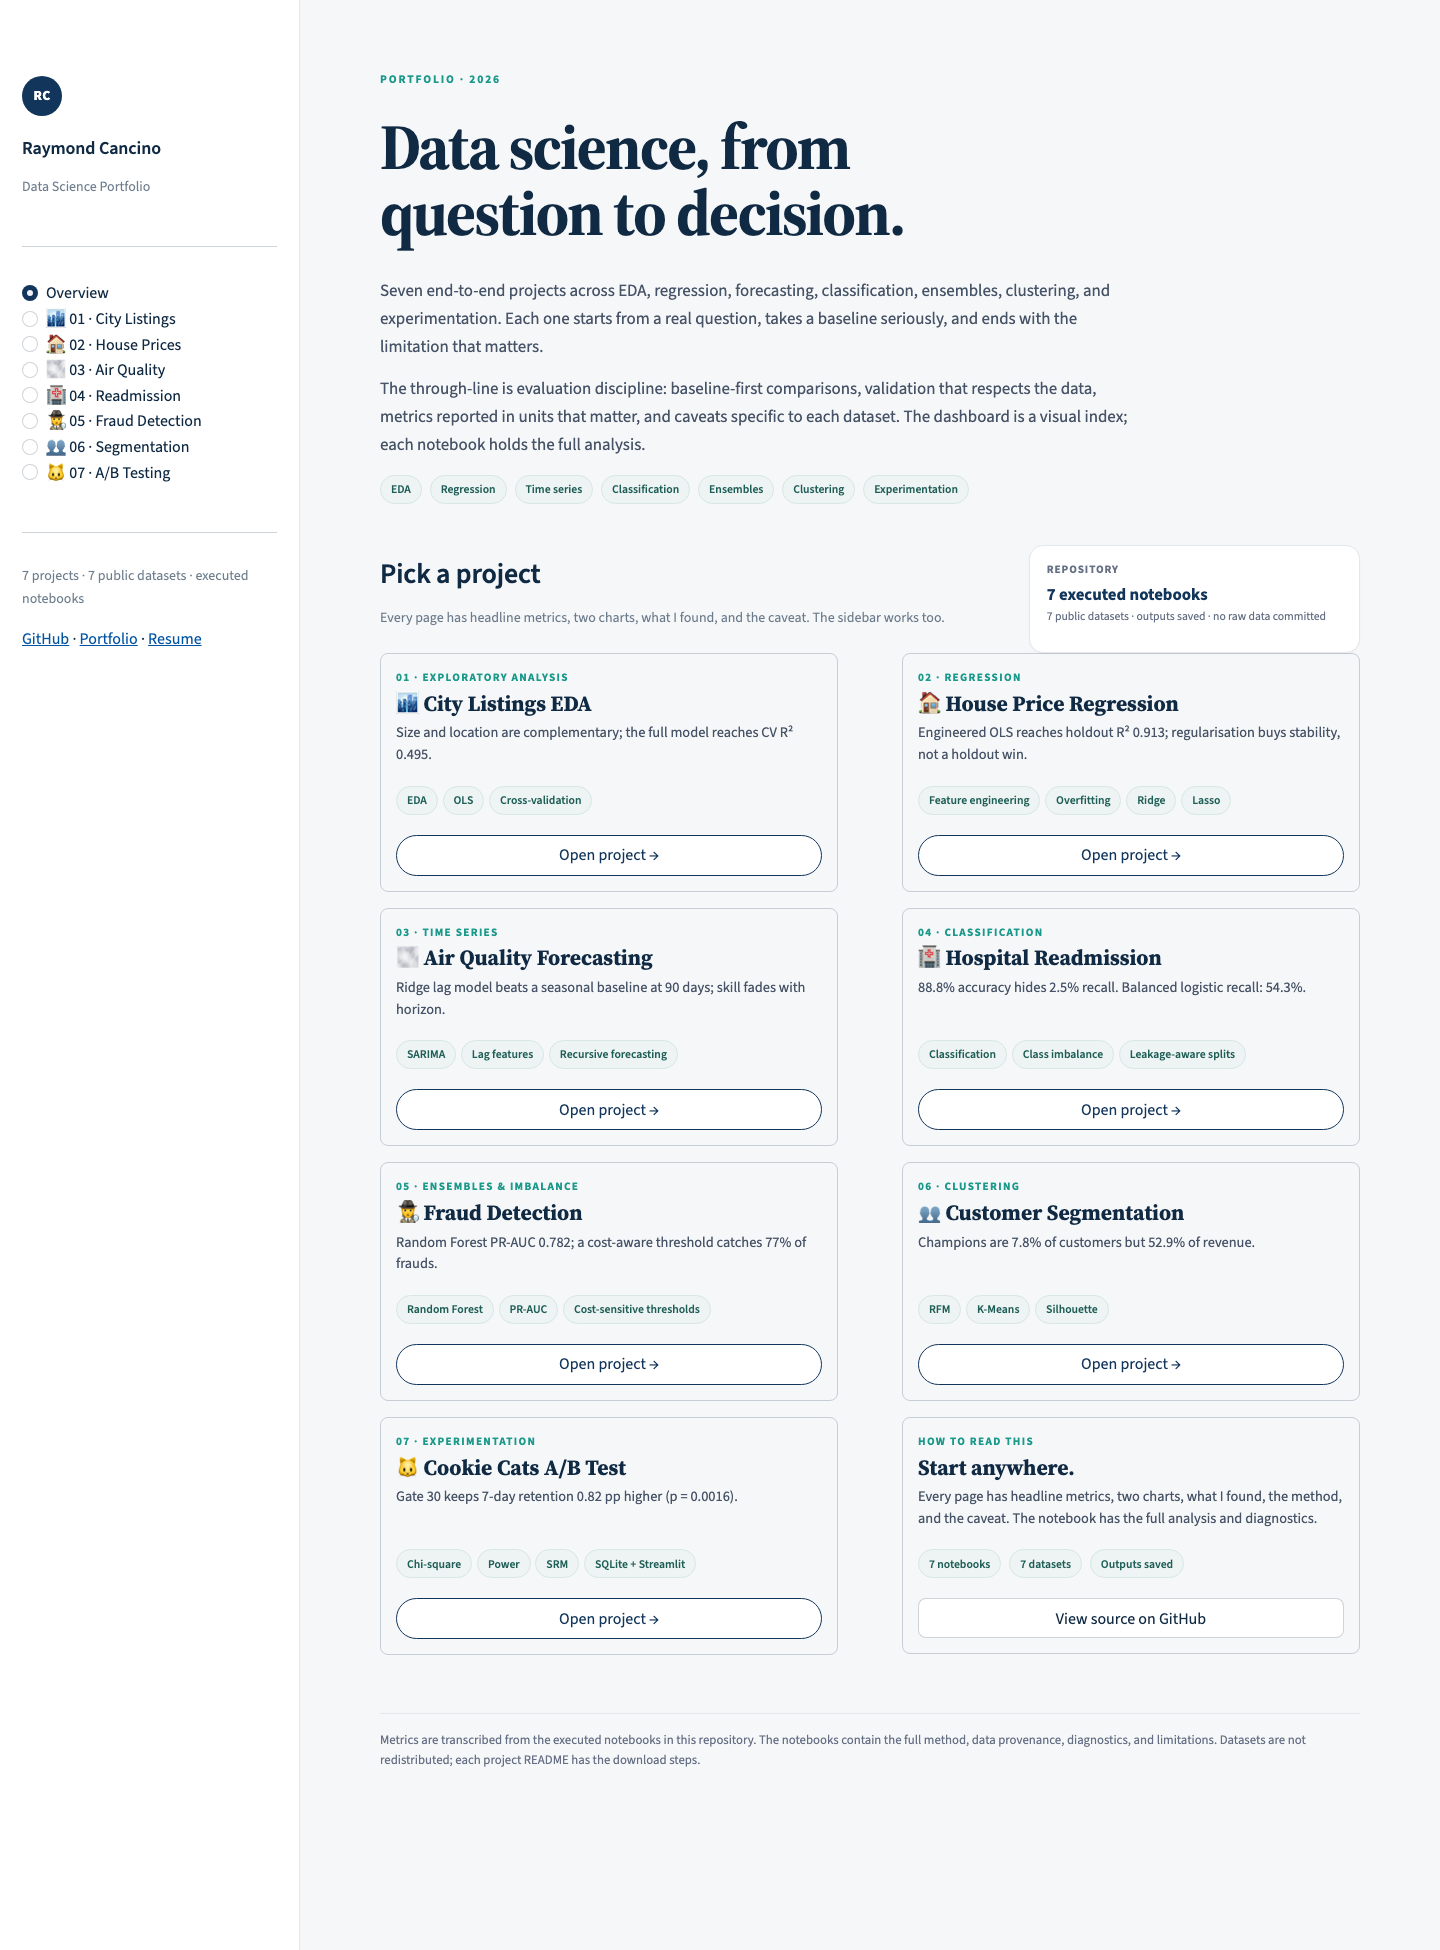 The Streamlit dashboard: an overview page for seven projects, with a page per project
Run it locally with pip install -r requirements.txt then streamlit run dashboard/app.py, or open the live app.
Evaluation Discipline
- Baseline first. Every project has a simple, defensible reference point before any model, and reports the gap in units that matter: dollars, µg/m³, patients, transactions, percentage points.
- Validation that respects the data. A grouped patient split for readmission, chronological splits for fraud and air quality, thresholds chosen on validation and evaluated once on test.
- Cleaning as decisions. Each filter, imputation, or exclusion states what it costs and which rows it removes.
- Limitations, named. Every notebook closes with what the result does not imply and what would overturn it.
Stack
Python · pandas · scikit-learn · statsmodels · Altair · Streamlit · Jupyter. Datasets are public but not committed; each project README records the source, licence, and exact download steps.
Takeaway
The portfolio is the argument. A result is only useful if the reader can see the baseline it beat, the validation it survived, and the scope it holds within. Seven notebooks and one dashboard, and no project ends at a leaderboard score.