E-Commerce Logistics Analytics
An analytics-engineering pipeline that turns 99k orders of Brazilian e-commerce data into one answer: where deliveries break down, and why.
Overview
A self-hosted analytics stack built on the Olist Brazilian E-Commerce dataset. The point wasn't another dashboard exercise. It was to answer one operational question end to end: how is logistics performing, where are the problems, and why are those problems happening? The whole thing runs locally with docker compose up: ClickHouse for storage, dbt for transformation, Metabase for the dashboards.
The Problem
The analysis follows a three-step flow that mirrors how an ops team actually asks questions:
How are we doing? → Where are the problems? → Why are we seeing them?
Each step gets its own dashboard, so a viewer moves from a headline score, to the segments dragging it down, to the row-level orders behind them.
How It Works
| Layer | What happens |
|---|---|
| Raw (ClickHouse) | The 9 Olist CSVs are loaded verbatim by scripts/load_raw.sh: no cleaning at this stage. |
Staging (stg_*) | One view per source table: rename, cast, standardize. |
Intermediate (int_*) | Delivery delay/severity, freight ratios, seller metrics, customer-experience metrics, data-quality flags. |
Marts (fct_* / dim_*) | The business-facing tables Metabase queries. No business logic lives in the BI layer. |
Every layer boundary is enforced by dbt tests: the generic kind (unique, not_null, relationships, accepted_values) plus custom business-rule assertions like "delivery date can't precede purchase date."
 Pipeline stack: ingestion into ClickHouse, dbt transformations, and Metabase dashboards
What the Data Showed
- Delivery is solid; geography is the fault line. 90.4% of orders arrive on time, but 4+ day-late rates range from 1.6% (RO) to 16.7% (AL), a spread that points at last-mile distance from the fulfillment hub, not seller quality.
- Reviews track delay severity. Average rating falls from 4.29 stars on time to 1.70 stars at 8+ days late: a 2.6-star swing, monotonic across every bucket.
- Cost isn't the culprit. Freight ratio stays flat around 0.308 of order value across severity groups, which rules out "expensive shipping equals slow shipping."
- The composite score averages 84.3/100. Customer Experience (70.5) is the weakest of the four weighted components, so it's the one that actually moves the headline number.
The Dashboards
Three Metabase dashboards mirror the analytical flow above, plus a Home dashboard that links between them. Every card queries a mart directly, so no business logic hides in the BI layer.
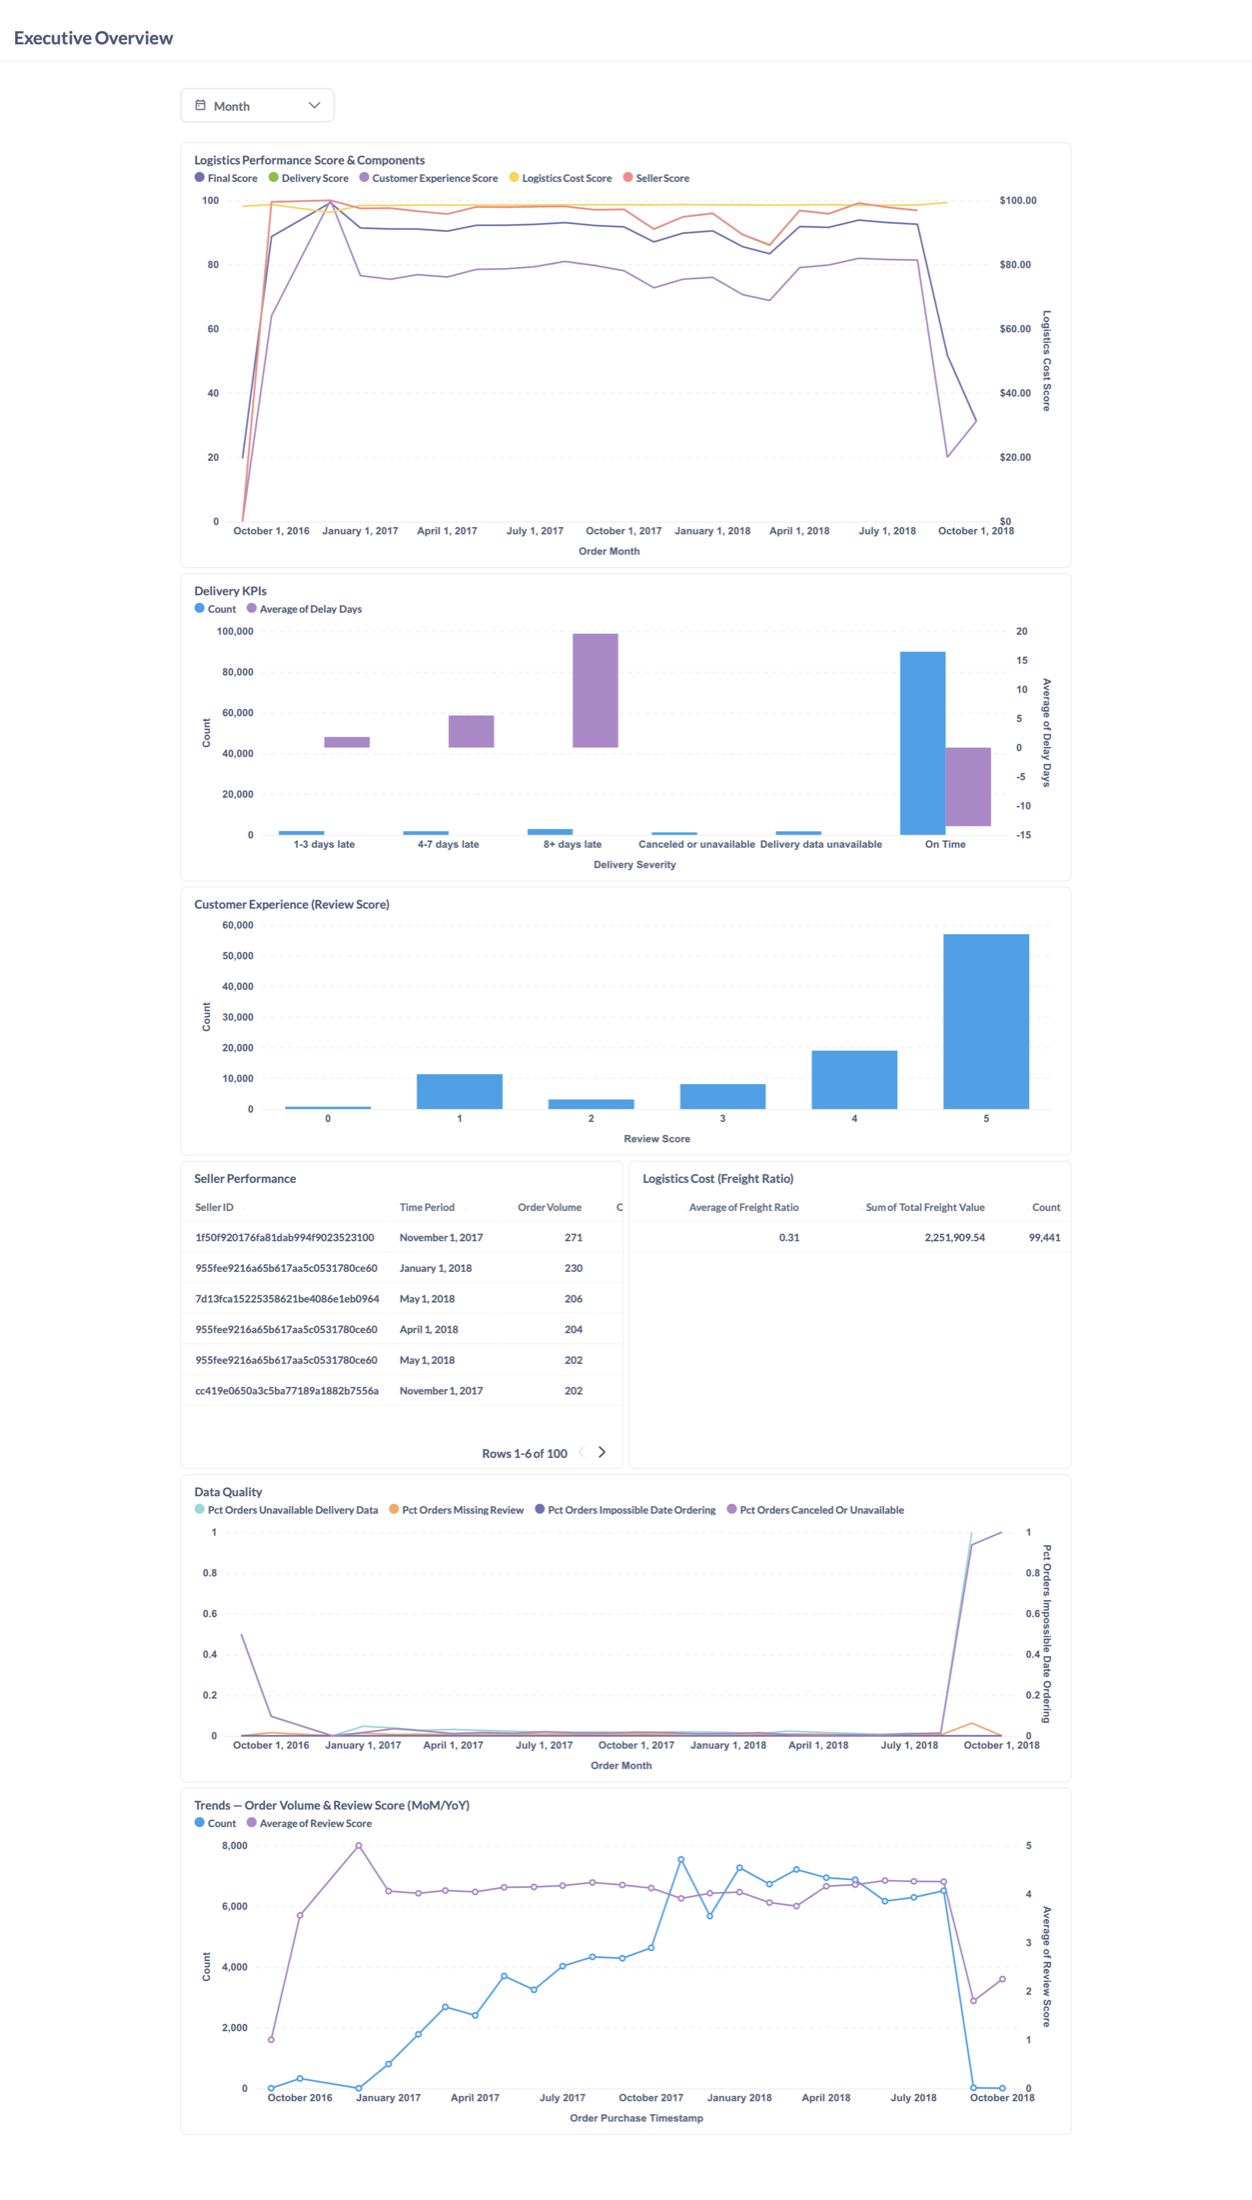 Executive Overview: composite logistics score, its components, and volume/quality trends
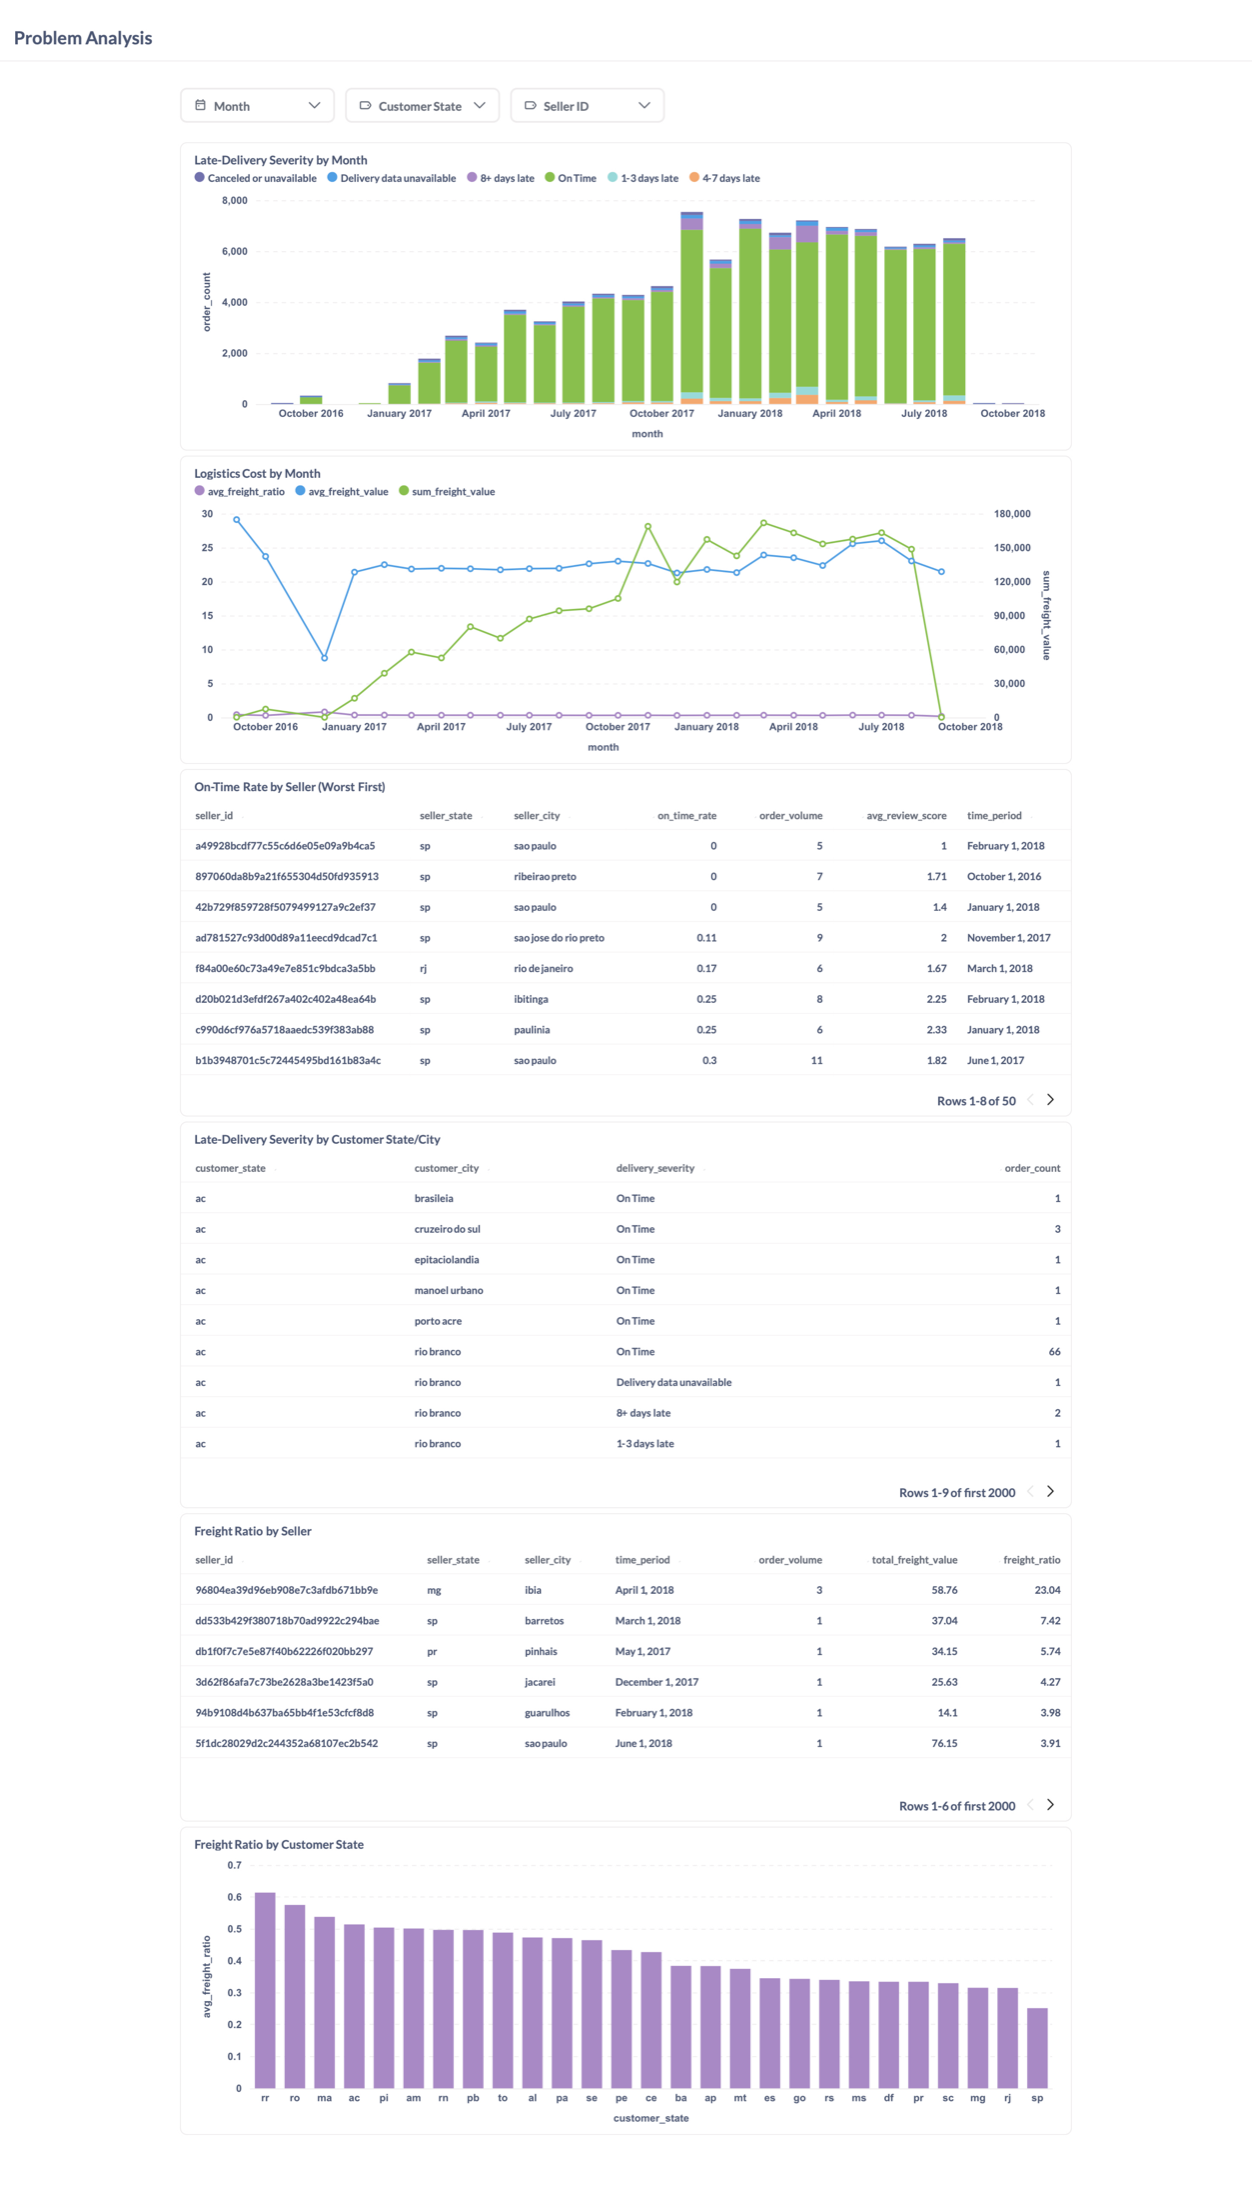 Problem Analysis: late-delivery severity and freight ratio sliced by month, seller, and geography
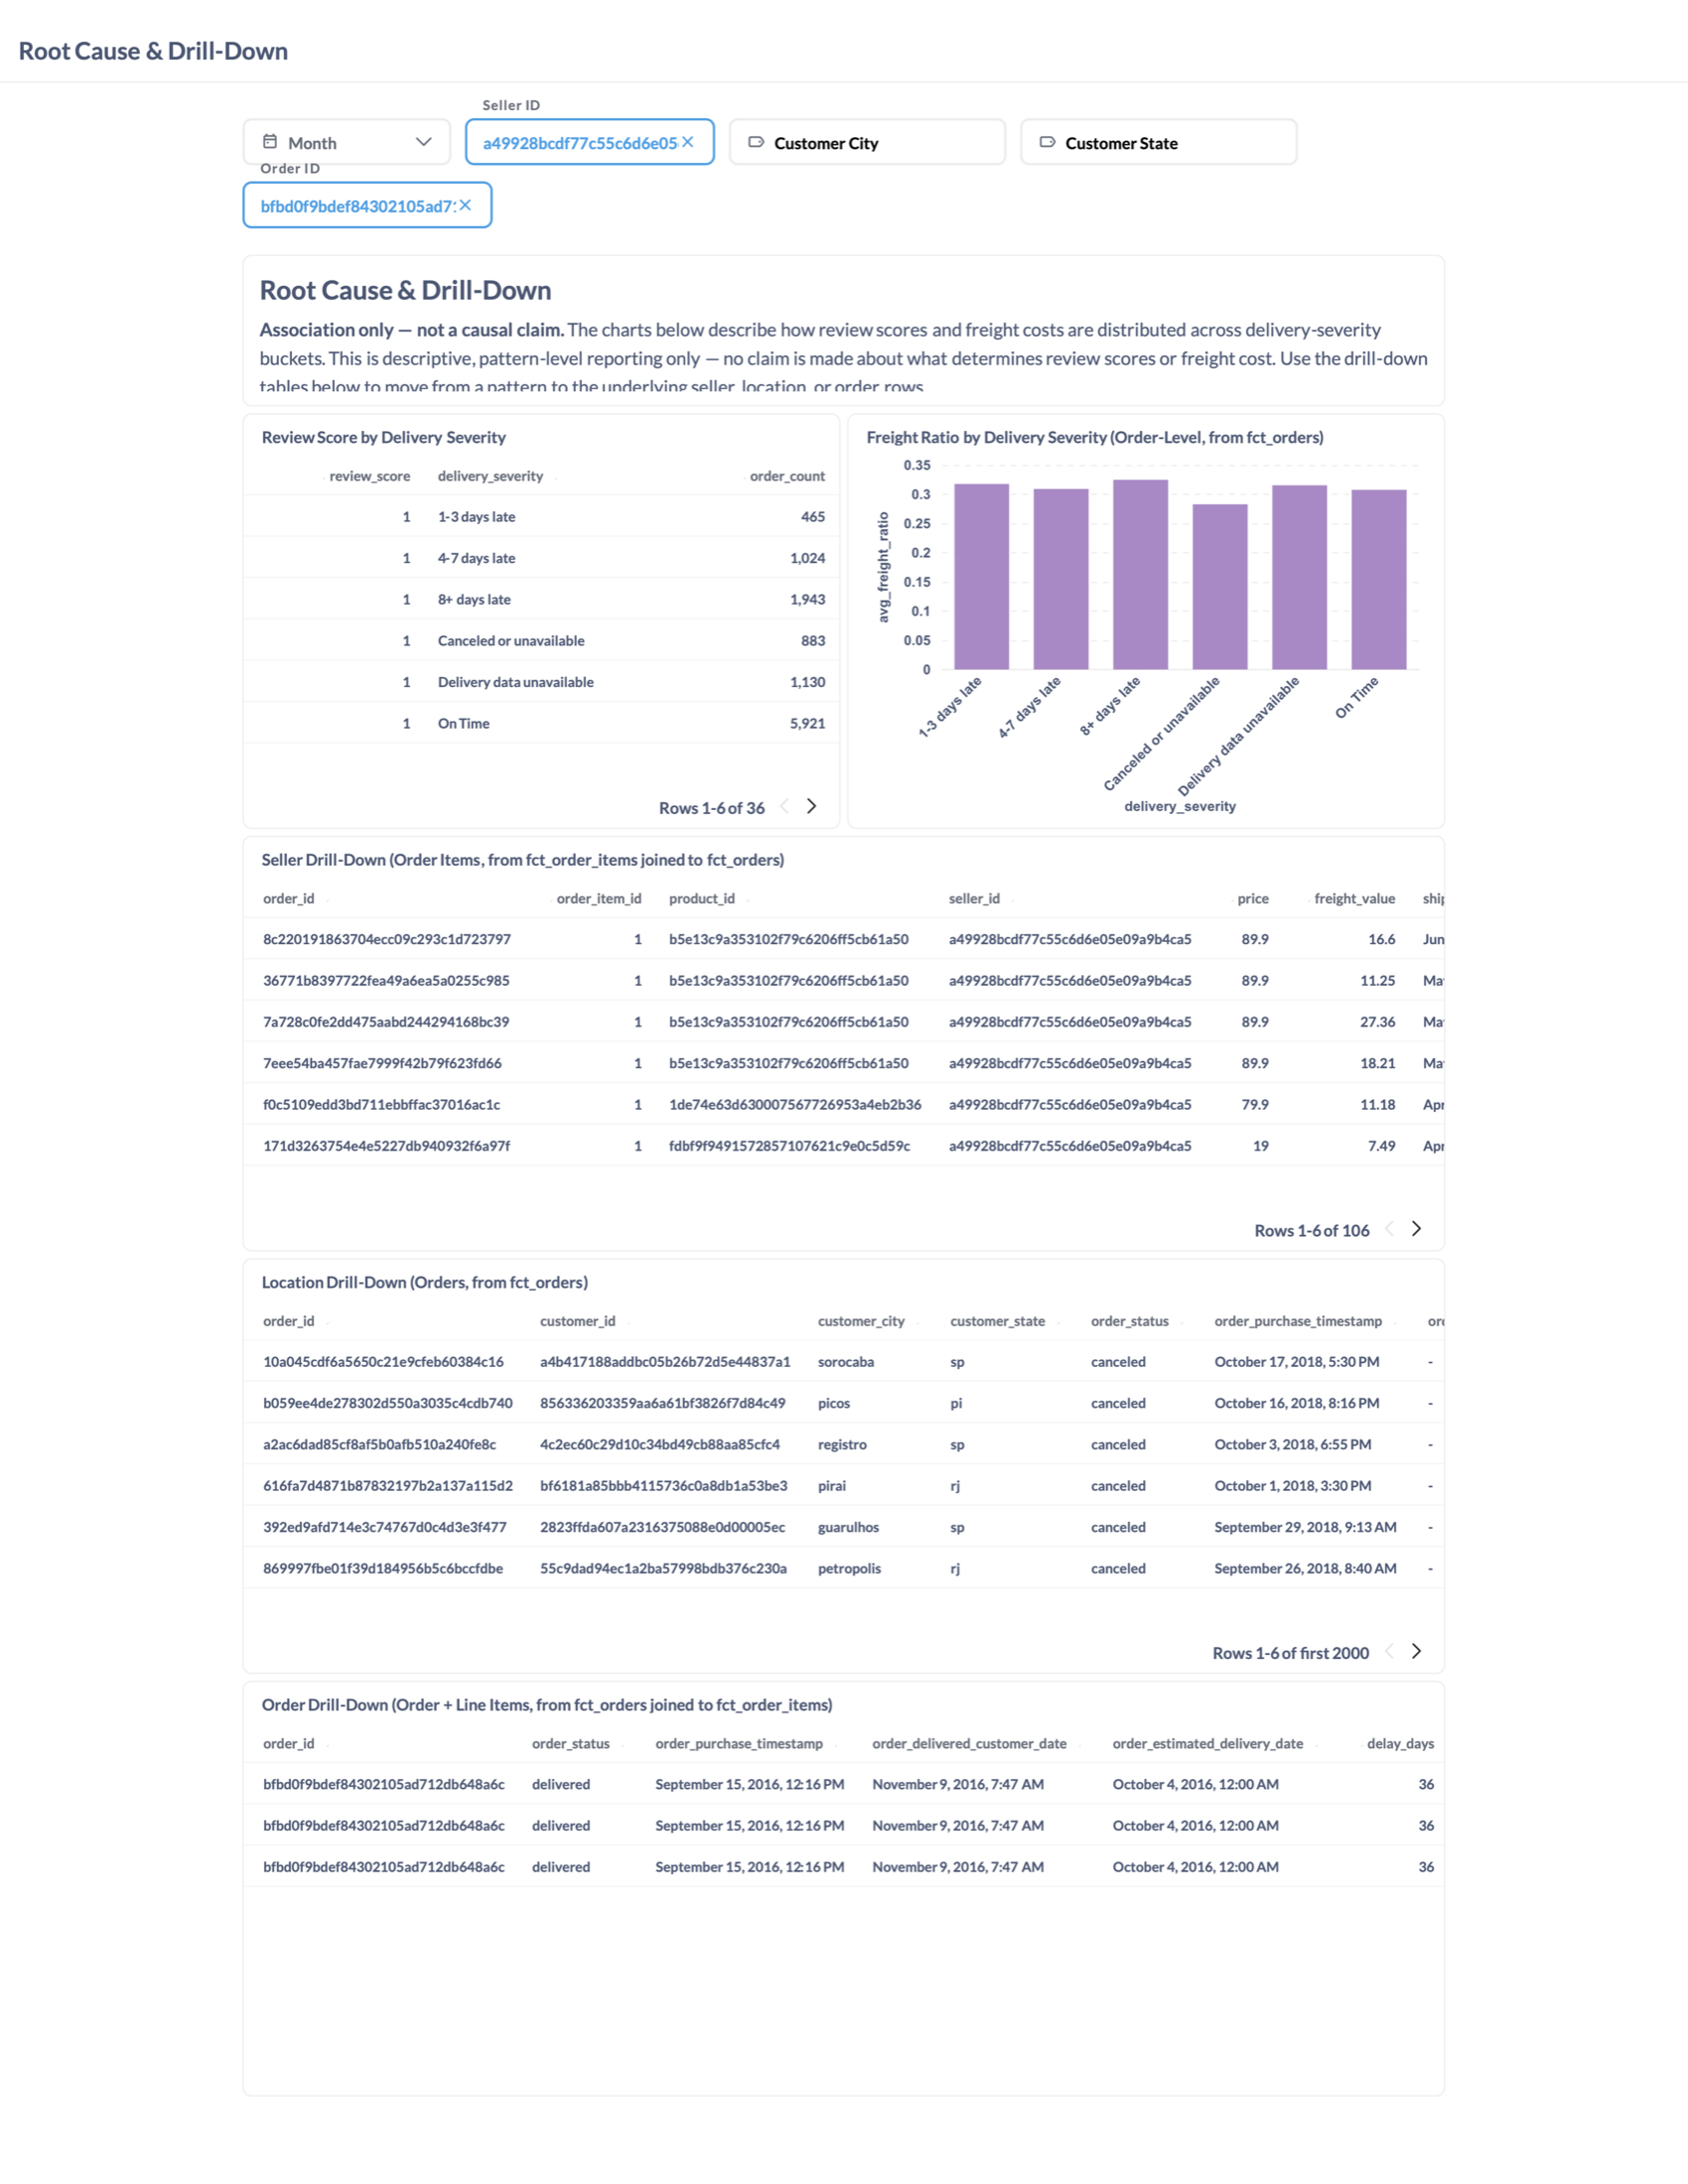 Root Cause & Drill-Down: review score by delivery severity, with row-level order detail
Stack
ClickHouse · dbt · Metabase · Docker Compose · Python · uv, deliberately self-hosted so the pipeline is reproducible and free to run, while still using the same tools you'd reach for against Snowflake or BigQuery.
Takeaway
The interesting result here wasn't a dashboard. It's that the logistics problem turned out to be geographic and operational rather than cost-driven. The full model lineage, tests, and setup live in the repository README.