Rossmann Sales Forecasting
A daily sales forecast for 1,115 Rossmann stores with XGBoost, served through a FastAPI endpoint and a Streamlit dashboard from one Docker image. Built as the ML Zoomcamp midterm project.
Overview
Store managers plan staffing, stock, and promotions from a sales forecast, and being off by €1,000 per store-day is expensive in either direction: too much staff wastes payroll, too little loses sales. This project answers a narrow version of that question: given a store and a date, what daily sales should we expect?
The output is a point forecast in euros with the model's error stated up front. It is served two ways from the same artifact: a FastAPI endpoint for programmatic use and a Streamlit dashboard for a store operator, both packaged in one Docker image.
This is the midterm project for ML Zoomcamp, the DataTalksClub course. The brief asks for a described problem and dataset, EDA, several models with tuned parameters, the notebook exported to a training script, a deployed web service, managed dependencies, and a Dockerfile, with cloud deployment as a bonus. The rest of this page follows that checklist.
The Data
- 1,017,209 store-days across 1,115 stores, from 2013-01-01 to 2015-07-31, plus 1,115 store records with type, assortment, competition distance and open date, and
Promo2participation. - Closed and zero-sales days are removed, leaving 844,338 open store-days (172,871 rows dropped).
- Excluded from the features:
Customers(known only after the day), the targetSales, andOpen(rows are already filtered to open days). That is the leakage checklist for a retail forecast. - 21 features are known at forecast time: calendar (year, month, day, day of week, week of year, day of year, month edges, weekend, days to Christmas), promotion and holiday flags, and static store attributes.
The Split
The split is temporal, not random, because a random split would let the model see the future.
| Window | Period | Use |
|---|---|---|
| Train | 2013-01-01 to 2015-05-31 | Fit the candidate models |
| Validation | 2015-06-01 to 2015-06-30 | Tune and select |
| Test | 2015-07-01 to 2015-07-31 | Score once, after the refit |
Model selection and hyperparameter tuning happen on validation, the winner is refit on train plus validation, and only then is the test month scored.
Models and Results
All metrics are on open store-days, in euros. A store-median baseline sets the floor.
| Model | Validation RMSE | Test RMSE | Test R² |
|---|---|---|---|
| Store-median baseline | 2,272.87 | 1,776.75 | 0.634 |
| Ridge (alpha = 0.1) | 1,437.54 | 1,341.70 | 0.791 |
| Random forest | 1,946.86 | 1,835.96 | 0.609 |
| XGBoost (tuned, served) | 921.53 | 936.59 | 0.898 |
The baseline, Ridge, and random forest rows come from one fit on the training window. The XGBoost row is the served artifact: the tuned winner was refit on train plus validation and scored once on the test month at 936.59 RMSE / 677.60 MAE / 0.898 R², a 47% RMSE reduction against the store-median baseline.
- XGBoost won at
max_depth=8,learning_rate=0.1, and 108 boosting rounds, after comparing six candidates across depth 6/8/10 and learning rates 0.03/0.05/0.10 on validation. - Ridge beat the random forest, which is the result worth explaining. The forest received store ID as an ordinal number, so it had to split arbitrary ID ranges rather than isolate stores, and the signal is largely additive (promotion, day of week, store type). XGBoost's native categorical handling fixed the first problem and boosting fixed the second. The forest is kept in as an honest bagging benchmark, not a straw man.
- The error is reported in business units. RMSE and MAE are in euros, on open days, for a future month the model never saw.
The Dashboard
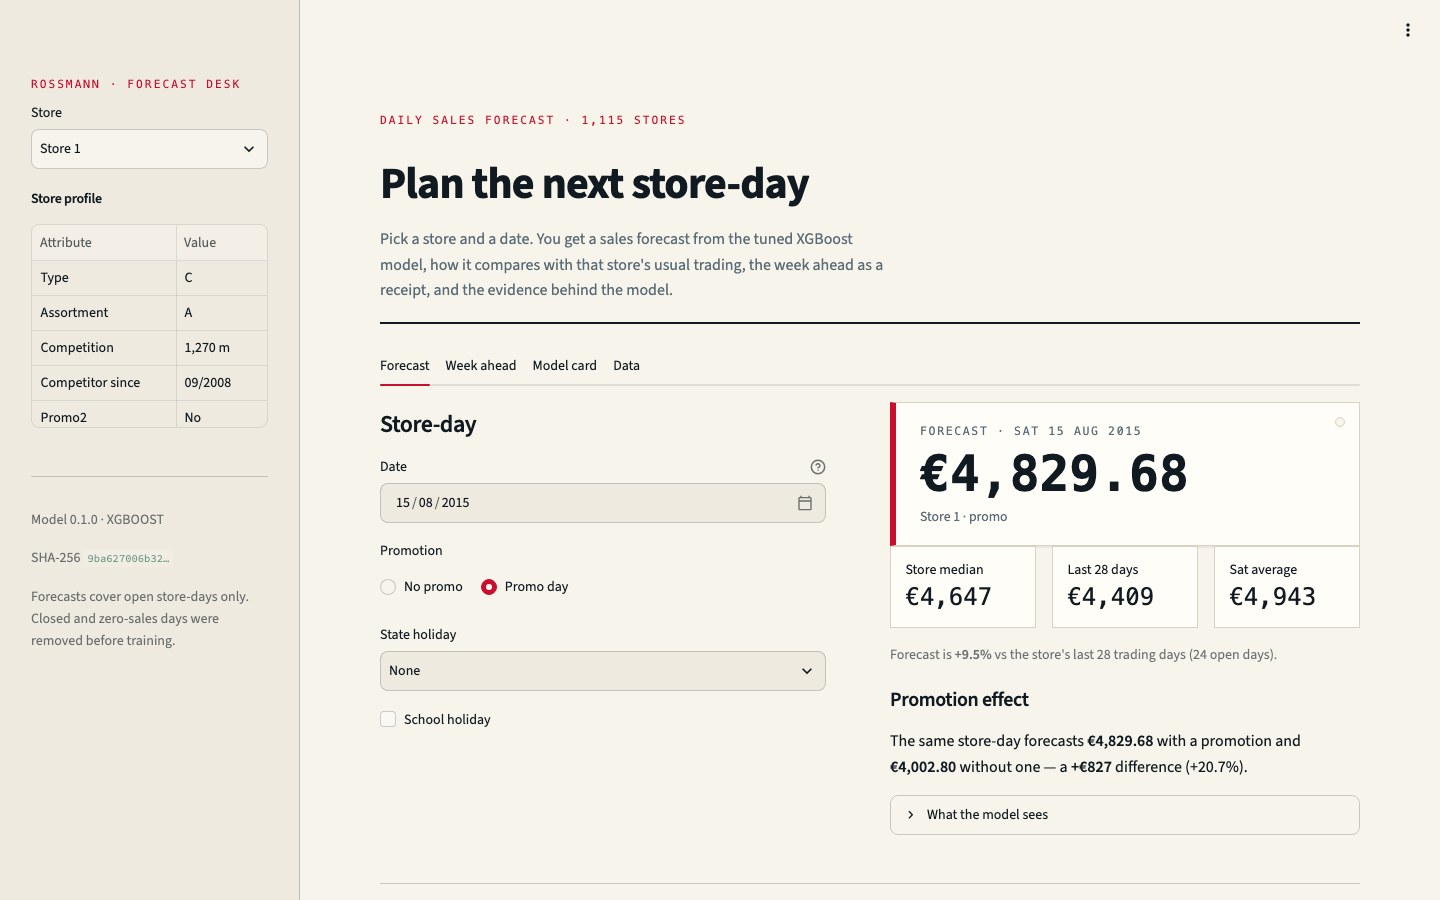
The dashboard reads the same artifact through the same serving.SalesForecaster used by the API, so a forecast cannot disagree between the two front ends. Store 1 on 15 August 2015 with a promotion returns €4,829.68 in both places.
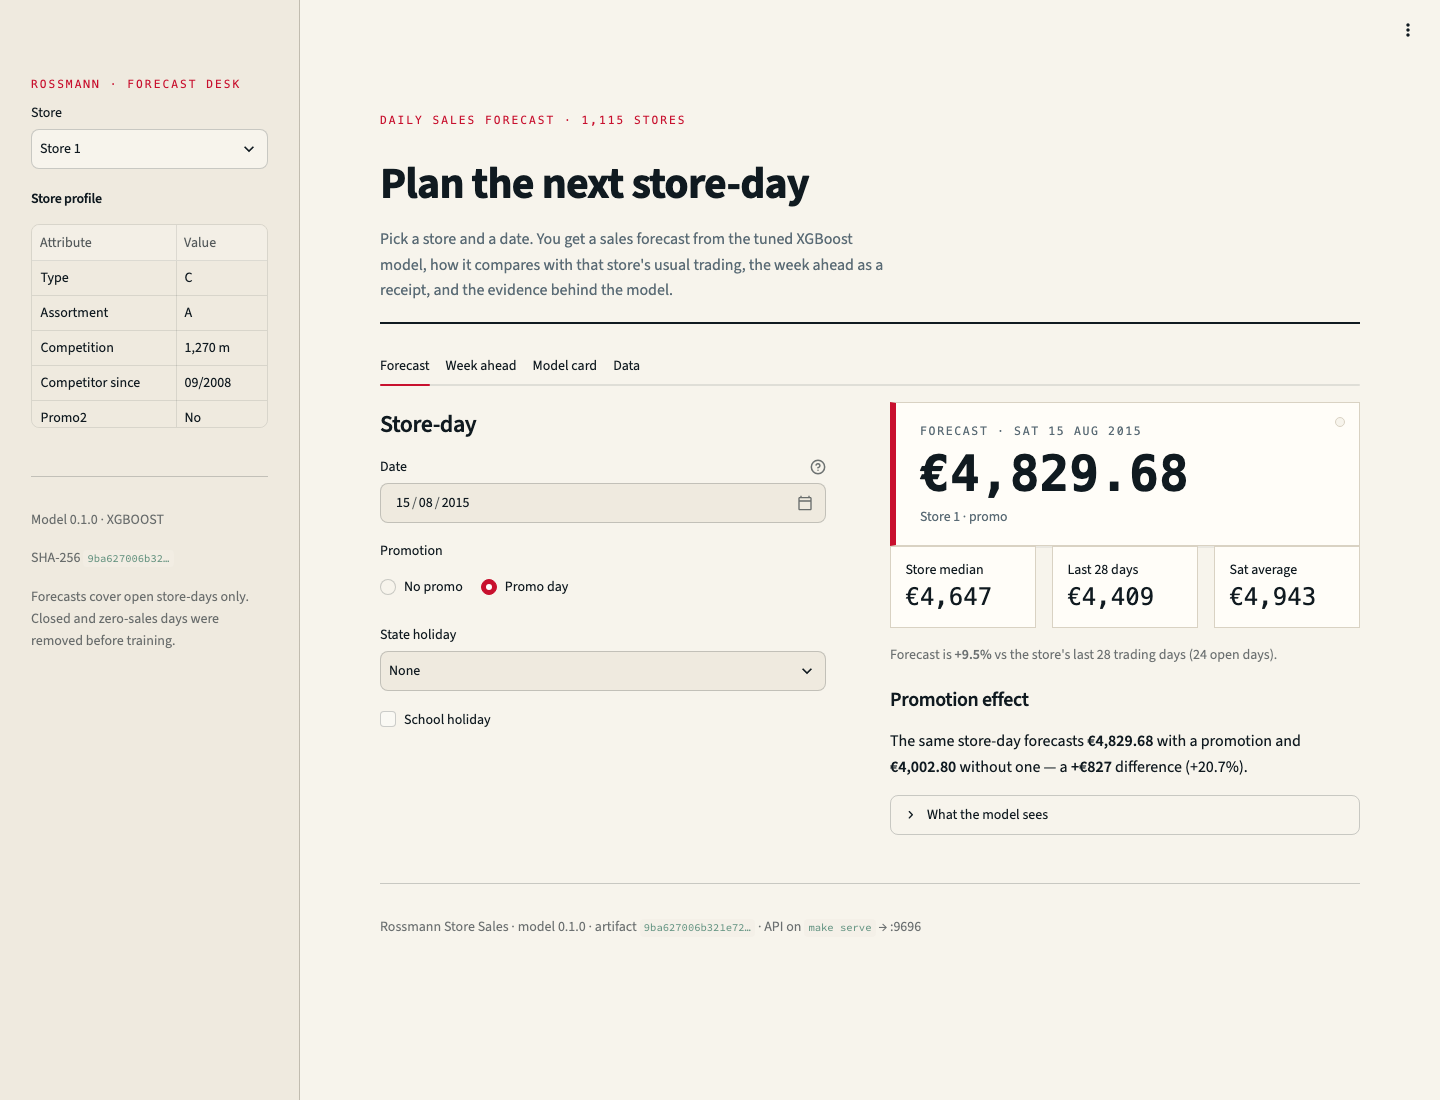 The Streamlit forecast desk: store profile, store-day forecast, and the learned promotion effect
It has four tabs:
- Forecast: a store-day price tag with the forecast, the store median, the last-28-day mean, and the same-weekday mean, plus the learned promotion lift and the exact 21-feature row the model receives.
- Week ahead: 7 to 28 days as a receipt, with promotion weekdays and school holidays. Weekdays the store never opened on are marked closed and excluded from the total, and the table downloads as CSV.
- Model card: test RMSE, MAE, and R², the model comparison, the six-point tuning grid, the selected parameters, feature groups, and artifact hashes.
- Data: monthly seasonality, promotion lift by weekday, and the selected store's weekday rhythm.
The same store-day without a promotion forecasts €4,002.80, a €827 (20.7%) difference the model learned from the promotion flag alone.
Deployment
POST /predictserves store-day forecasts;GET /healthexposes the model version and SHA-256 so a reviewer can prove which artifact is running.- Inputs are validated: stores 1 to 1115,
promo0/1,state_holiday0/a/b/c,school_holiday0/1, and dates from 2013-01-01 to 2015-12-31. Invalid values return 422, unknown store IDs return 404.
curl -s http://localhost:9696/predict \
  -H 'Content-Type: application/json' \
  -d '{"store": 1, "date": "2015-08-15", "promo": 1, "state_holiday": "0", "school_holiday": 0}'
- The Docker image builds from
python:3.12-slim-bookworm, copiesuvfrom its official image, and installs fromuv.lock. The same image runs the API and, with a different command, the dashboard. - 26 tests cover the API, the shared serving layer, the history helpers, and the dashboard, all runnable against the committed artifact without retraining.
- The dashboard is live on Streamlit Community Cloud; the FastAPI service is Docker-only.
Reproducibility
uv.lock pins every dependency and pyproject.toml declares Python 3.12. prepare_data.py downloads the raw files and verifies their SHA-256, and the processed parquet (4.3 MB) is committed, so training and serving work without the raw data. Model metadata records the metrics, tuned parameters, library versions, training timestamp, and artifact hashes. make data, make train, make serve, make ui, and make test cover the whole loop.
Limitations
- Closed days are filtered. The model forecasts open store-days; a production system also needs an
Openclassifier or a store calendar. - No external data. Weather, local events, and competitor openings could improve accuracy, but were out of scope for the midterm.
- One test month. A rolling-origin backtest over 6 to 12 months would give a stronger estimate of generalization.
- Point forecasts only. Quantile regression or conformal intervals would support staffing decisions under uncertainty.
Stack
Python 3.12 · pandas · scikit-learn · XGBoost · FastAPI · Streamlit · Docker · uv, with tests in pytest.
Takeaway
The business framing drove the technical choices: a temporal split, a store-median floor, and errors reported in euros. The random forest losing to Ridge is the useful reminder that a more complex model only wins when its inductive bias matches the data. Sharing one inference layer between the API and the dashboard keeps both front ends honest with each other.