Stack Overflow End-to-End Data Pipeline
A full cloud data pipeline that scrapes 14 years of Stack Overflow Developer Survey data and carries it from raw ZIP files to an interactive Looker dashboard.
Overview
An end-to-end data pipeline built on the Stack Overflow Developer Survey: 14 years of data covering 2011 through 2024. The goal was to practice the full lifecycle of a modern data stack: ingestion, processing, warehousing, modeling, and visualization, wired together with orchestration and infrastructure-as-code rather than run by hand.
The Problem
Survey data this large is awkward to analyze raw. It spans programming-language trends, salary distributions, educational demographics, occupation breakdowns, and shifts in technology adoption across countries and years. The pipeline turns those scattered annual releases into a single structured, queryable dataset that can answer questions like how language popularity evolves over time, what drives salary differences, and where regional tech adoption diverges.
How It Works
The pipeline follows a clean stage-by-stage flow, provisioned with Terraform and driven by Airflow:
| Stage | What happens |
|---|---|
| Ingestion | Python scrapes the survey data and uploads raw ZIP files to Google Cloud Storage. |
| Processing | PySpark extracts CSVs from the GCS archives, then cleans and transforms them. |
| Loading | The cleaned data is loaded into BigQuery. |
| Modeling | dbt runs additional SQL transformations for analytics. |
| Visualization | The final dataset is served through Looker. |
| Orchestration | Apache Airflow, running on Docker, manages the whole workflow. |
| Infrastructure | Terraform provisions the GCS buckets and BigQuery datasets/tables. |
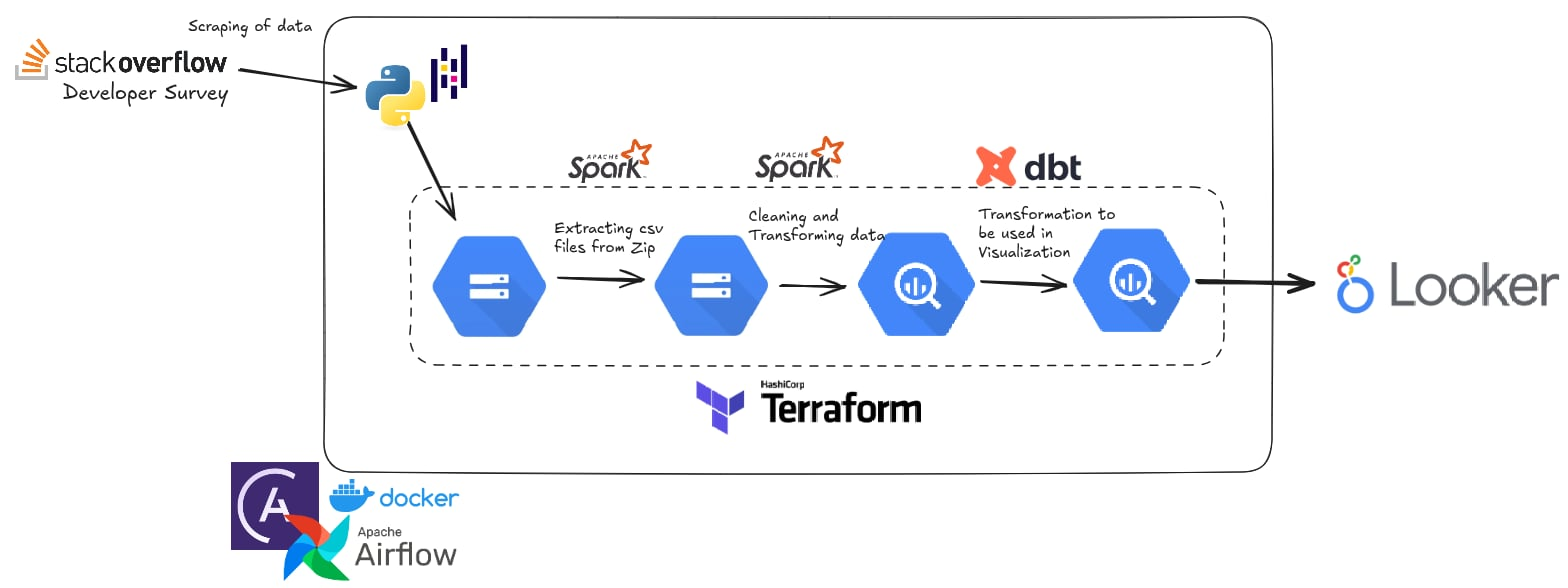 End-to-end pipeline: scraping and ingestion into GCS, PySpark processing, BigQuery loading, dbt modeling, and Looker visualization
A single DAG, stackoverflow_end_to_end_dag, coordinates the run: scrape or download, upload to GCS, transform with PySpark, model with dbt, and load the clean data into BigQuery.
What It Does
The dashboard lets you explore technology trends over the 14-year span, salary distributions sliced by skills, experience, and geography, educational demographics, and the changing makeup of tech occupations. It's the payoff stage of the pipeline, the point where the cleaned and modeled data finally becomes something you can read at a glance.
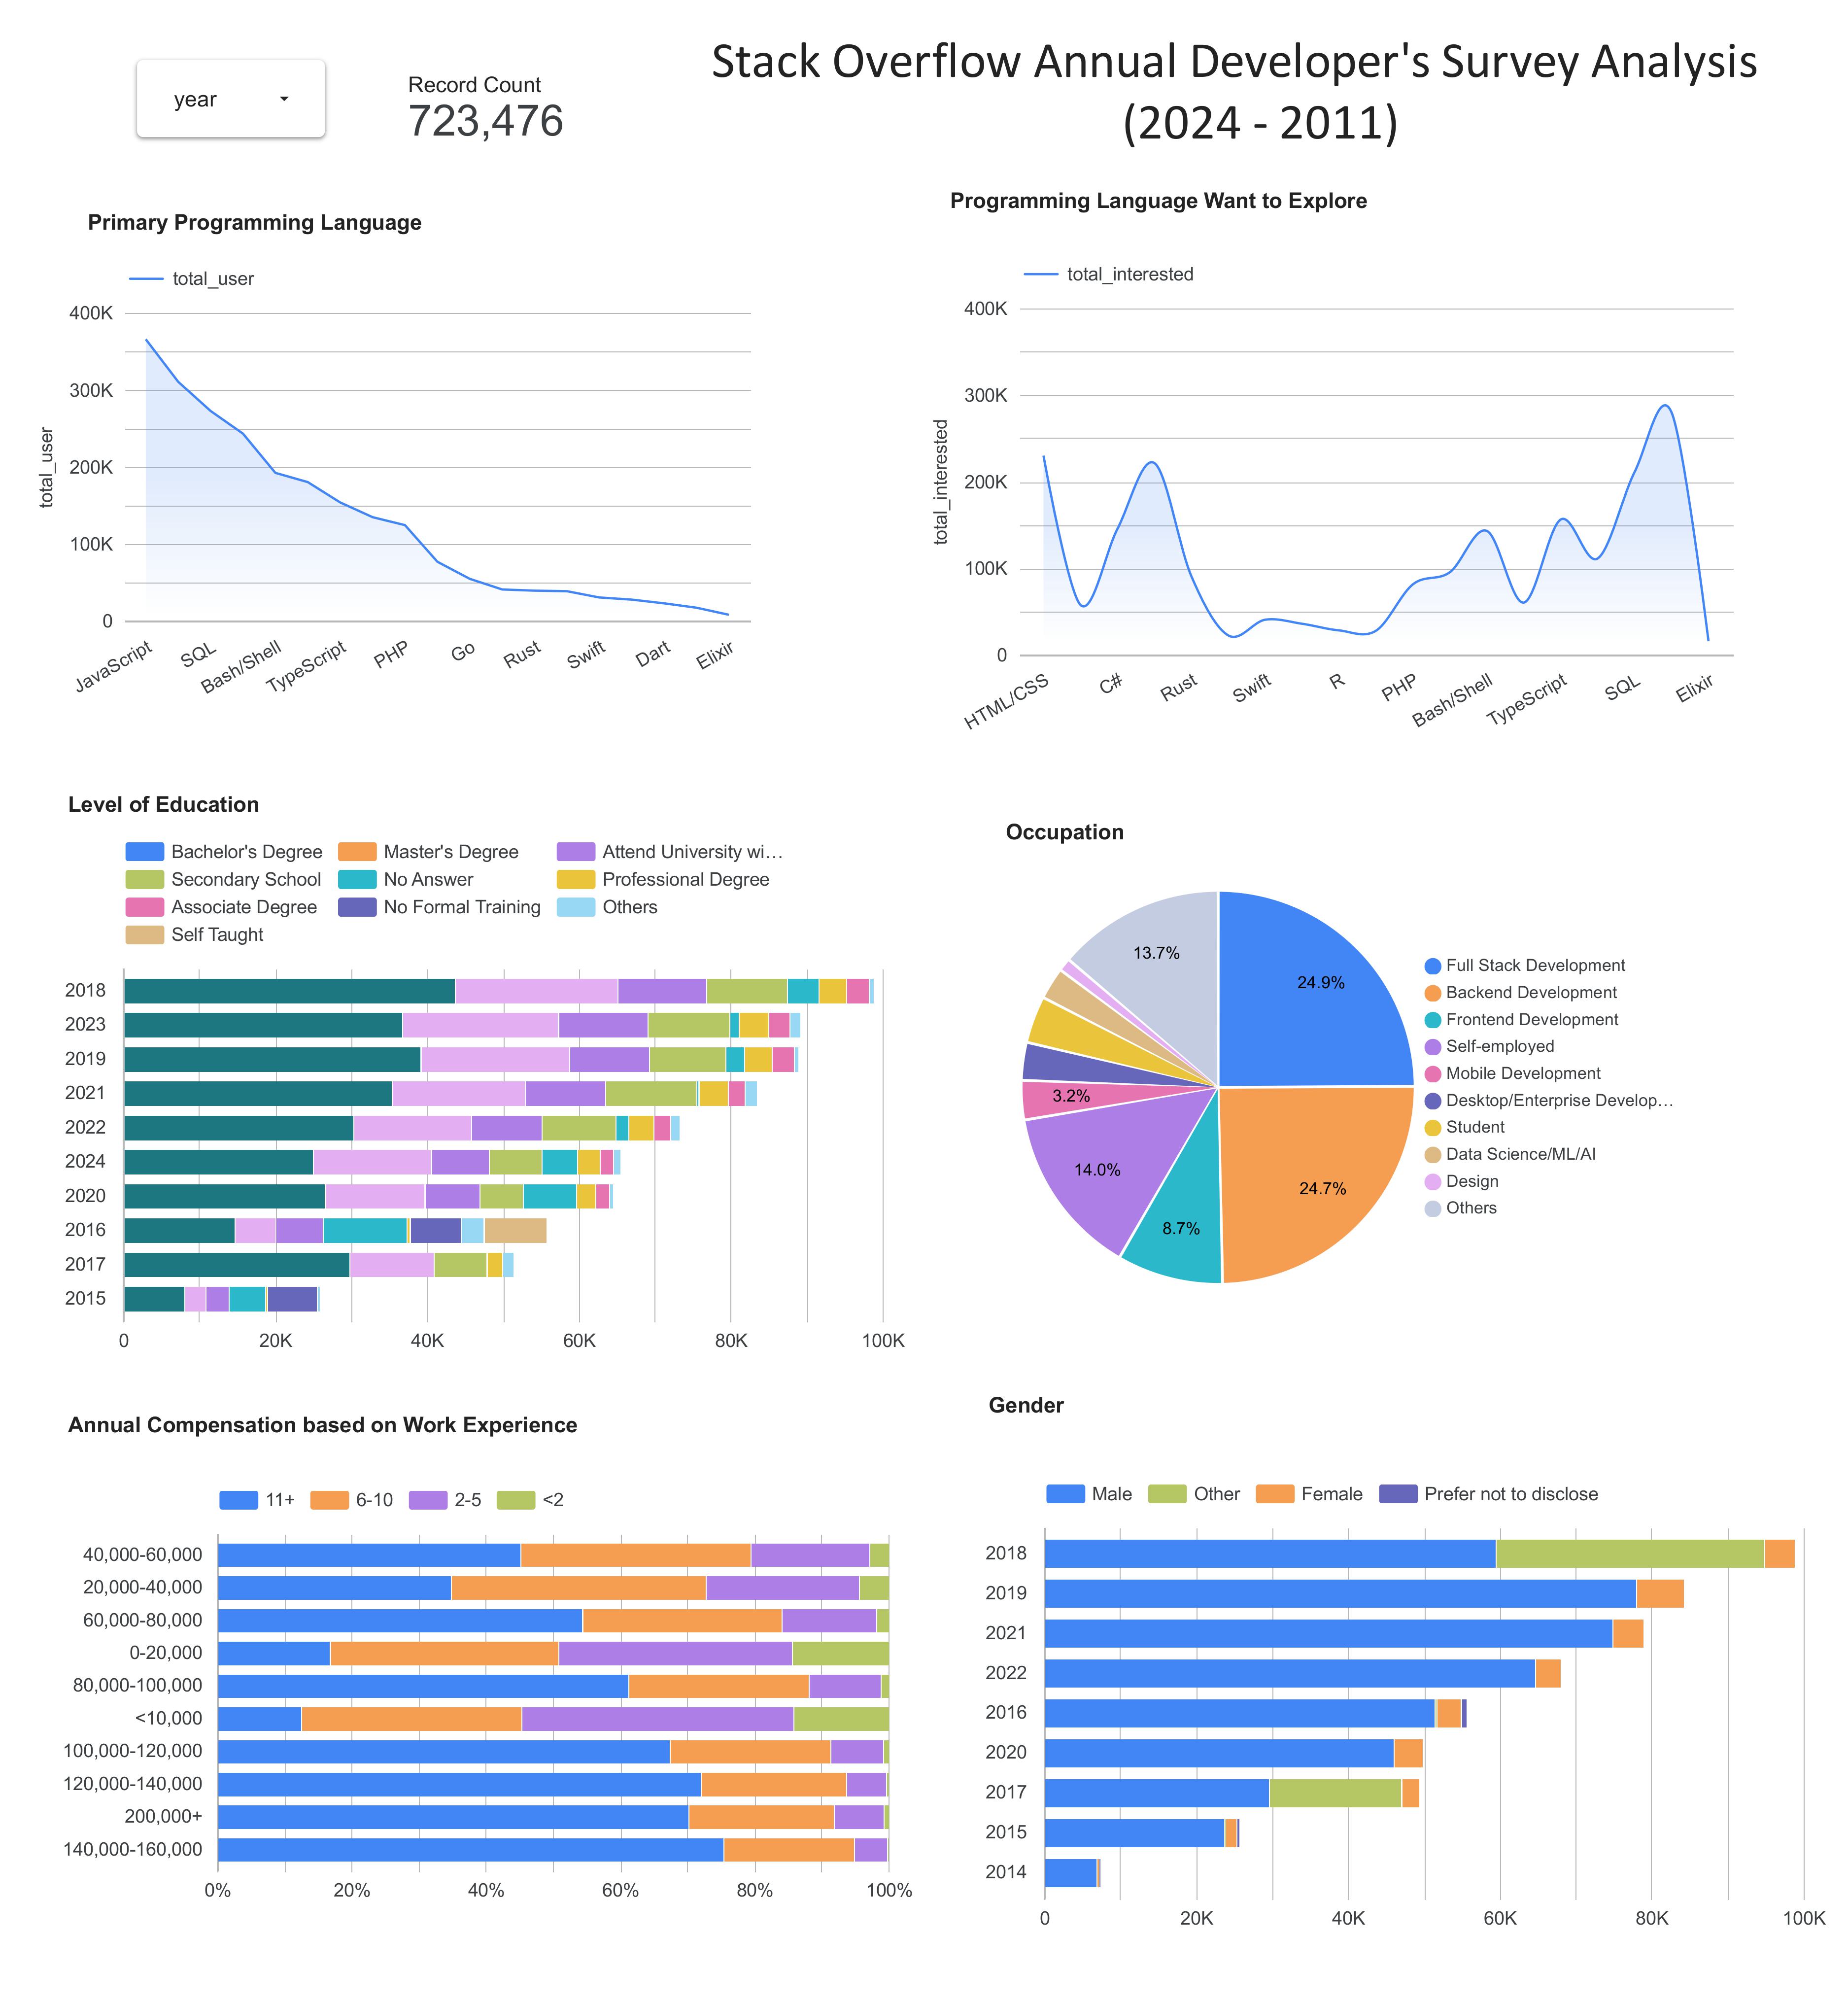 Survey analysis dashboard exploring technology trends, salaries, and developer demographics
The published report is live on Looker Studio: Stack Overflow Annual Developer's Survey Analysis.
Stack
Python · Apache Airflow · Docker · dbt · PySpark · Google Cloud Storage · BigQuery · Terraform · Pandas · Looker.
Takeaway
The value of this project is in the seams: handing data cleanly from scraping to object storage, from PySpark to a warehouse, and from dbt models to a dashboard, with Airflow keeping the stages in order and Terraform making the infrastructure reproducible. It's inspired by the DataTalksClub Data Engineering Zoomcamp, and the full setup lives in the repository README.