Weather Data Pipeline
A containerized ETL pipeline that pulls live weather from OpenWeatherMap into PostgreSQL, then serves it through Metabase dashboards, all reproducible with one Docker Compose command.
Overview
A self-contained weather data pipeline built to practice the full collection-to-visualization path without leaning on a managed data stack. A Python job pulls readings from the OpenWeatherMap API, lands them in PostgreSQL, and exposes them for exploration in Metabase. Everything runs locally behind Docker Compose.
How It Works
| Layer | What happens |
|---|---|
| Collection | weather_pipeline.py calls the OpenWeatherMap API and writes structured readings into the database. |
| Storage | PostgreSQL holds the data, with the schema provisioned up front from database_setup.sql on first boot. |
| Visualization | Metabase connects to PostgreSQL and renders the saved question views as dashboards. |
| Orchestration | Docker Compose brings up all three services together (the database, the Python pipeline, and Metabase) in one shot. |
The pipeline runs as its own service, so it can be triggered on schedule or manually with docker compose exec weather_app python weather_pipeline.py. Logs and generated plots are written out to the logs/ and plots/ directories for inspection.
Dashboards
Two Metabase views summarize the collected data: one tracking how conditions move over time, the other showing the distribution across readings.
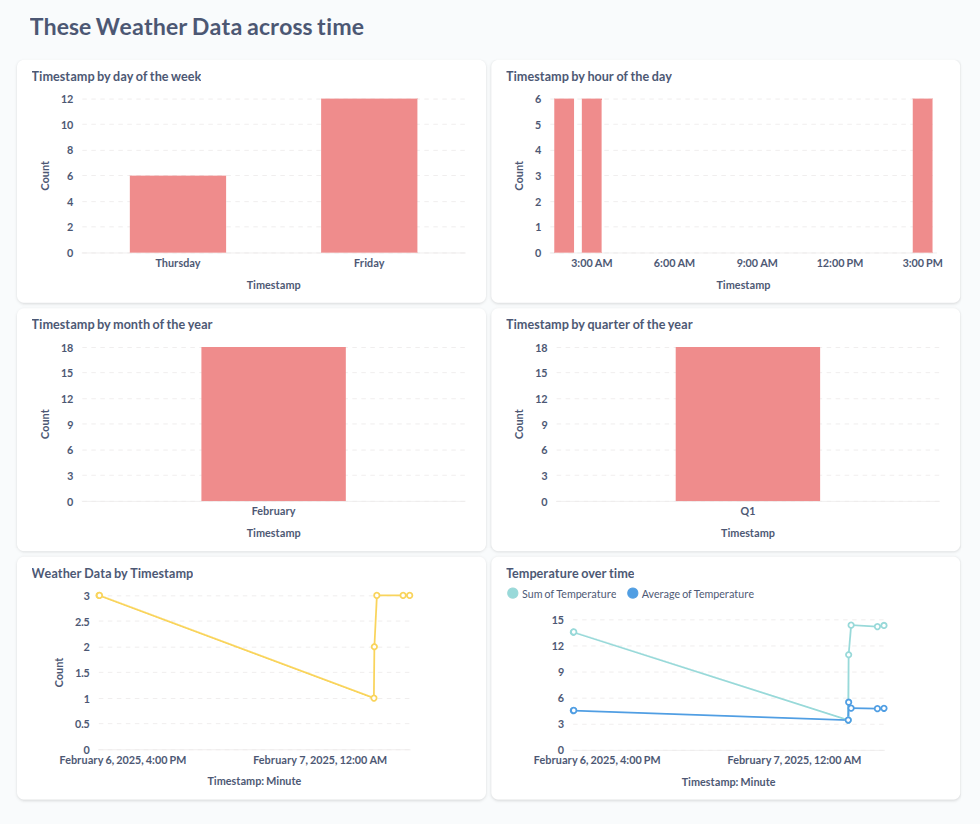 Metabase dashboard: weather data across time
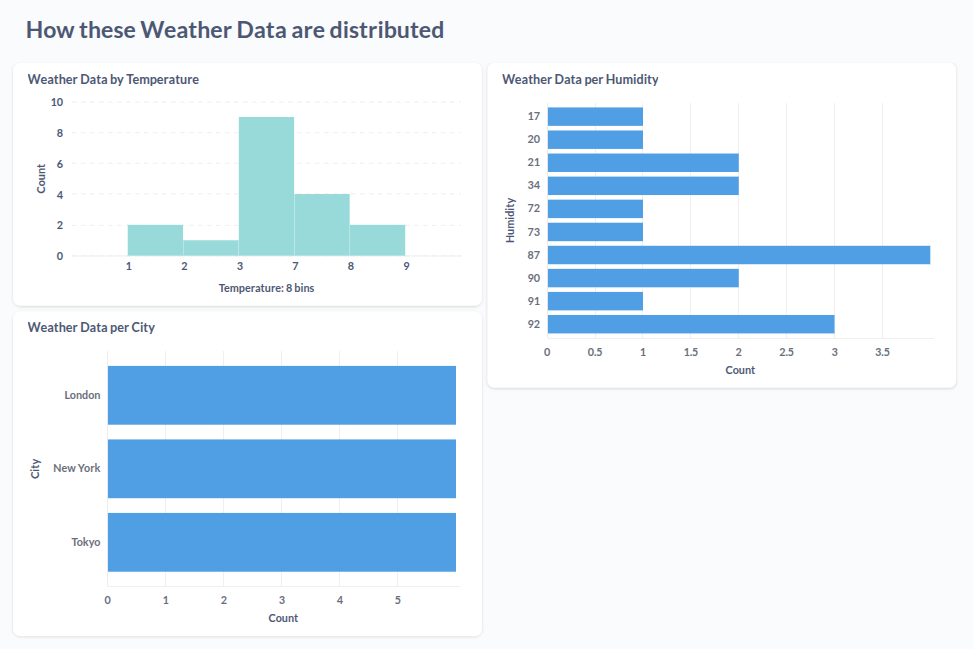 Metabase dashboard: weather data distribution
Stack
Python 3.11+ · PostgreSQL · Metabase · Docker Compose · OpenWeatherMap API, chosen so the whole pipeline spins up from a single command and stays free to run locally.
Takeaway
The value here is the wiring: an API source, a real relational store, and a BI layer glued together reproducibly with containers. It's a compact template for the ingestion pattern that shows up in much larger stacks, minus the infrastructure overhead. Setup and configuration details live in the repository README.